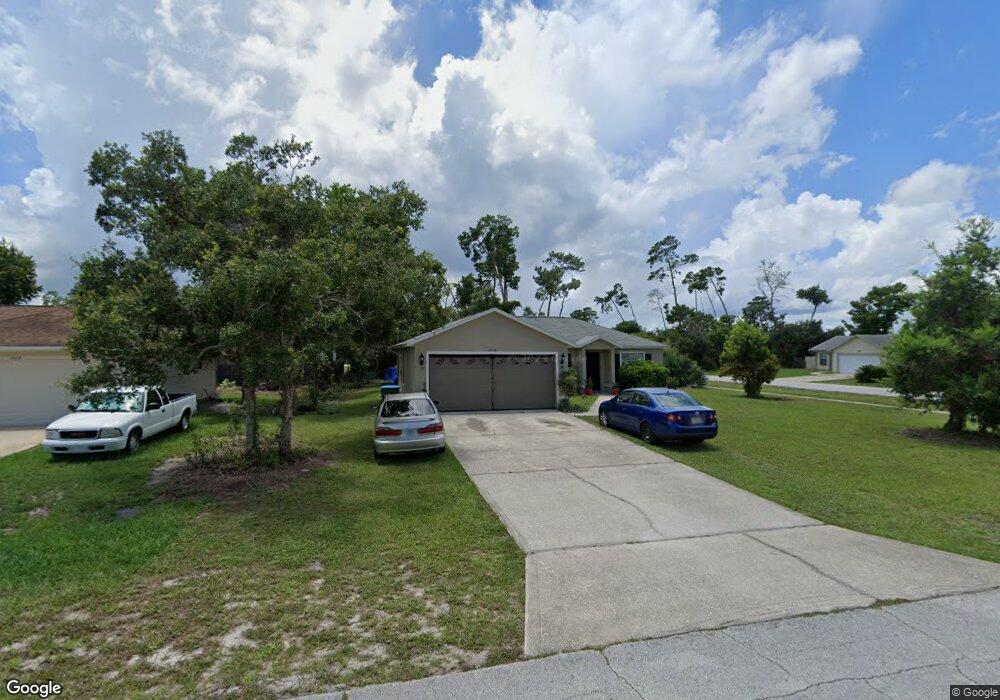
2636 Albury Ave Deltona, FL 32738
Estimated Value: $258,000 - $270,244
3
Beds
2
Baths
1,770
Sq Ft
$149/Sq Ft
Est. Value
About This Home
This home is located at 2636 Albury Ave, Deltona, FL 32738 and is currently estimated at $263,811, approximately $149 per square foot. 2636 Albury Ave is a home located in Volusia County with nearby schools including Friendship Elementary School, Galaxy Middle School, and Pine Ridge High School.
Ownership History
Date
Name
Owned For
Owner Type
Purchase Details
Closed on
Jun 24, 2016
Sold by
Sewell Mark James
Bought by
Song Xili
Current Estimated Value
Purchase Details
Closed on
Aug 4, 2003
Sold by
Rock Elizabeth A
Bought by
Sewell Mark James
Home Financials for this Owner
Home Financials are based on the most recent Mortgage that was taken out on this home.
Original Mortgage
$92,568
Interest Rate
5.52%
Mortgage Type
FHA
Purchase Details
Closed on
Jan 31, 1997
Sold by
Mercedes Homes Inc
Bought by
Rock Elizabeth A
Home Financials for this Owner
Home Financials are based on the most recent Mortgage that was taken out on this home.
Original Mortgage
$49,980
Interest Rate
7.77%
Mortgage Type
FHA
Purchase Details
Closed on
Oct 17, 1996
Sold by
Teal James L and Frank Erwin H
Bought by
Mercedes Homes Inc
Purchase Details
Closed on
Dec 15, 1974
Bought by
Song Xili
Create a Home Valuation Report for This Property
The Home Valuation Report is an in-depth analysis detailing your home's value as well as a comparison with similar homes in the area
Home Values in the Area
Average Home Value in this Area
Purchase History
| Date | Buyer | Sale Price | Title Company |
|---|---|---|---|
| Song Xili | $112,500 | Esquire Title Services Llc | |
| Sewell Mark James | $96,000 | -- | |
| Rock Elizabeth A | $74,700 | -- | |
| Mercedes Homes Inc | $11,500 | -- | |
| Song Xili | $1,600 | -- |
Source: Public Records
Mortgage History
| Date | Status | Borrower | Loan Amount |
|---|---|---|---|
| Previous Owner | Sewell Mark James | $92,568 | |
| Previous Owner | Rock Elizabeth A | $49,980 |
Source: Public Records
Tax History Compared to Growth
Tax History
| Year | Tax Paid | Tax Assessment Tax Assessment Total Assessment is a certain percentage of the fair market value that is determined by local assessors to be the total taxable value of land and additions on the property. | Land | Improvement |
|---|---|---|---|---|
| 2025 | $3,875 | $226,389 | $50,423 | $175,966 |
| 2024 | $3,875 | $226,796 | $50,423 | $176,373 |
| 2023 | $3,875 | $217,306 | $52,290 | $165,016 |
| 2022 | $3,586 | $188,969 | $37,350 | $151,619 |
| 2021 | $3,355 | $145,687 | $27,639 | $118,048 |
| 2020 | $3,138 | $140,051 | $20,169 | $119,882 |
| 2019 | $3,014 | $129,794 | $15,687 | $114,107 |
| 2018 | $2,769 | $109,778 | $9,935 | $99,843 |
| 2017 | $2,551 | $92,066 | $7,844 | $84,222 |
| 2016 | $2,158 | $77,036 | $0 | $0 |
| 2015 | $951 | $50,825 | $0 | $0 |
| 2014 | $923 | $50,422 | $0 | $0 |
Source: Public Records
Map
Nearby Homes
- 3036 Beal St
- 2493 Hope Ave
- 2689 Courtland Blvd
- 3057 Avon Ct
- 2837 Sweet Springs St
- 2822 Fulford St
- 2361 Kimberly Dr
- 2824 Corrigan Dr
- 2861 Brighton Ave
- 3201 N Tulsa Dr
- 2780 W Covington Dr
- 3209 S Dorchester Dr
- 0 Riverhead Dr
- 3259 Butterfield St
- 2816 S Elston Dr
- 3267 Butterfield St
- 2412 Ainsworth Ave
- 2271 Conway Dr
- 3232 Lackland Dr
- 3197 Riverhead Dr