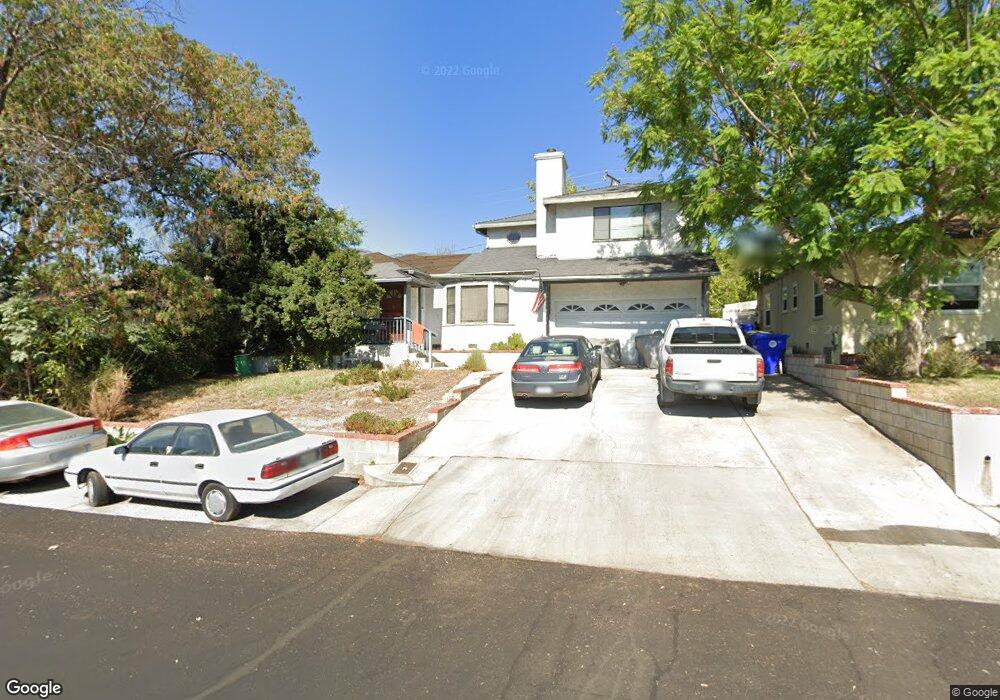
2639 Fairway Ave Montrose, CA 91020
Sparr Heights NeighborhoodEstimated Value: $1,324,000 - $1,850,000
3
Beds
2
Baths
2,692
Sq Ft
$557/Sq Ft
Est. Value
About This Home
This home is located at 2639 Fairway Ave, Montrose, CA 91020 and is currently estimated at $1,499,856, approximately $557 per square foot. 2639 Fairway Ave is a home located in Los Angeles County with nearby schools including La Crescenta Elementary School, Rosemont Middle School, and Crescenta Valley High School.
Ownership History
Date
Name
Owned For
Owner Type
Purchase Details
Closed on
Aug 19, 1998
Sold by
King Dennis W
Bought by
Kardas Mark G and Baltay Julie A
Current Estimated Value
Home Financials for this Owner
Home Financials are based on the most recent Mortgage that was taken out on this home.
Original Mortgage
$307,350
Outstanding Balance
$63,896
Interest Rate
6.88%
Estimated Equity
$1,435,960
Purchase Details
Closed on
Jan 20, 1996
Sold by
King Cynthia L
Bought by
King Dennis W
Home Financials for this Owner
Home Financials are based on the most recent Mortgage that was taken out on this home.
Original Mortgage
$25,000
Interest Rate
7.18%
Purchase Details
Closed on
Sep 14, 1993
Sold by
King Dennis W and King Susan J
Bought by
King Dennis W
Home Financials for this Owner
Home Financials are based on the most recent Mortgage that was taken out on this home.
Original Mortgage
$296,000
Interest Rate
4.87%
Create a Home Valuation Report for This Property
The Home Valuation Report is an in-depth analysis detailing your home's value as well as a comparison with similar homes in the area
Home Values in the Area
Average Home Value in this Area
Purchase History
| Date | Buyer | Sale Price | Title Company |
|---|---|---|---|
| Kardas Mark G | $336,500 | Southland Title Corporation | |
| King Dennis W | -- | Gateway Title Company | |
| King Dennis W | -- | Chicago Title Insurance Co |
Source: Public Records
Mortgage History
| Date | Status | Borrower | Loan Amount |
|---|---|---|---|
| Open | Kardas Mark G | $307,350 | |
| Previous Owner | King Dennis W | $25,000 | |
| Previous Owner | King Dennis W | $296,000 |
Source: Public Records
Tax History Compared to Growth
Tax History
| Year | Tax Paid | Tax Assessment Tax Assessment Total Assessment is a certain percentage of the fair market value that is determined by local assessors to be the total taxable value of land and additions on the property. | Land | Improvement |
|---|---|---|---|---|
| 2025 | $6,235 | $527,516 | $255,684 | $271,832 |
| 2024 | $6,235 | $517,173 | $250,671 | $266,502 |
| 2023 | $6,102 | $507,033 | $245,756 | $261,277 |
| 2022 | $5,804 | $497,092 | $240,938 | $256,154 |
| 2021 | $5,694 | $487,346 | $236,214 | $251,132 |
| 2019 | $5,481 | $472,892 | $229,208 | $243,684 |
| 2018 | $5,354 | $463,620 | $224,714 | $238,906 |
| 2016 | $5,088 | $445,619 | $215,989 | $229,630 |
| 2015 | $4,978 | $438,926 | $212,745 | $226,181 |
| 2014 | $4,942 | $430,329 | $208,578 | $221,751 |
Source: Public Records
Map
Nearby Homes
- 2522 Fairway Ave
- 4328 Sunset Ave
- 2710 Piedmont Ave Unit 21
- 2434 Prospect Ave
- 2754 Montrose Ave
- 2743 Montrose Ave Unit 110
- 3928 La Crescenta Ave
- 2806 Manhattan Ave
- 2468 Montrose Ave Unit 6
- 4326 Briggs Ave
- 4133 La Crescenta Ave
- 2817 Montrose Ave
- 2700 Prospect Ave
- 2619 Mary St
- 2966 Piedmont Ave
- 3010 Montrose Ave Unit 33
- 3010 Montrose Ave Unit 3
- 2249 Montrose Ave Unit 7
- 3658 Sierra Vista Ave
- 3106 Honolulu Ave
- 2643 Fairway Ave
- 2633 Fairway Ave
- 2624 Mayfield Ave
- 2618 Mayfield Ave
- 2647 Fairway Ave
- 2629 Fairway Ave
- 2628 Mayfield Ave
- 2636 Fairway Ave
- 2614 Mayfield Ave
- 2642 Fairway Ave
- 2628 Fairway Ave
- 2634 Mayfield Ave
- 2653 Fairway Ave
- 2623 Fairway Ave
- 2648 Fairway Ave
- 2608 Mayfield Ave
- 2624 Fairway Ave
- 2638 Mayfield Ave
- 2647 Montrose Ave Unit F
- 2647 Montrose Ave