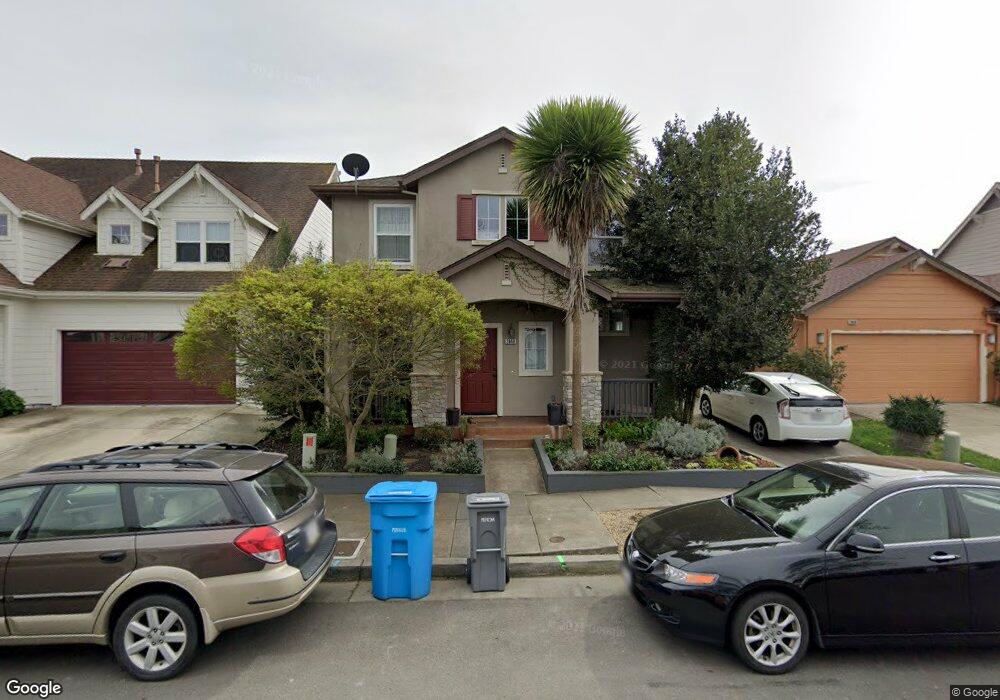
2640 Barndance Ln Santa Rosa, CA 95407
Wright Area Action Group NeighborhoodEstimated Value: $516,000 - $760,218
4
Beds
4
Baths
1,741
Sq Ft
$375/Sq Ft
Est. Value
About This Home
This home is located at 2640 Barndance Ln, Santa Rosa, CA 95407 and is currently estimated at $653,555, approximately $375 per square foot. 2640 Barndance Ln is a home located in Sonoma County with nearby schools including Elsie Allen High School and St. Michael's Orthodox School.
Ownership History
Date
Name
Owned For
Owner Type
Purchase Details
Closed on
Sep 5, 2024
Sold by
Pearlman Dana
Bought by
Dana J Pearlman 2024 Trust and Pearlman
Current Estimated Value
Purchase Details
Closed on
Aug 19, 2008
Sold by
Wolfe Deanna
Bought by
Pearlman Dana
Purchase Details
Closed on
Apr 26, 2007
Sold by
Pearlman Dana
Bought by
Pearlman Dana and Wolfe Deanna L
Home Financials for this Owner
Home Financials are based on the most recent Mortgage that was taken out on this home.
Original Mortgage
$488,000
Interest Rate
6.62%
Mortgage Type
Commercial
Purchase Details
Closed on
May 29, 2002
Sold by
Richmond American Homes Of Ca Inc
Bought by
Wolfe Deanna L and Pearlman Dana
Home Financials for this Owner
Home Financials are based on the most recent Mortgage that was taken out on this home.
Original Mortgage
$344,625
Interest Rate
6.83%
Mortgage Type
Commercial
Create a Home Valuation Report for This Property
The Home Valuation Report is an in-depth analysis detailing your home's value as well as a comparison with similar homes in the area
Home Values in the Area
Average Home Value in this Area
Purchase History
| Date | Buyer | Sale Price | Title Company |
|---|---|---|---|
| Dana J Pearlman 2024 Trust | -- | None Listed On Document | |
| Pearlman Dana | -- | None Available | |
| Pearlman Dana | -- | First American Title Company | |
| Pearlman Dana | -- | First American Title Company | |
| Wolfe Deanna L | $345,000 | First American Title Co |
Source: Public Records
Mortgage History
| Date | Status | Borrower | Loan Amount |
|---|---|---|---|
| Previous Owner | Pearlman Dana | $488,000 | |
| Previous Owner | Wolfe Deanna L | $344,625 |
Source: Public Records
Tax History Compared to Growth
Tax History
| Year | Tax Paid | Tax Assessment Tax Assessment Total Assessment is a certain percentage of the fair market value that is determined by local assessors to be the total taxable value of land and additions on the property. | Land | Improvement |
|---|---|---|---|---|
| 2025 | $5,546 | $479,887 | $159,085 | $320,802 |
| 2024 | $5,546 | $470,478 | $155,966 | $314,512 |
| 2023 | $5,546 | $461,254 | $152,908 | $308,346 |
| 2022 | $5,415 | $452,210 | $149,910 | $302,300 |
| 2021 | $5,358 | $443,344 | $146,971 | $296,373 |
| 2020 | $5,122 | $438,799 | $145,464 | $293,335 |
| 2019 | $5,059 | $430,196 | $142,612 | $287,584 |
| 2018 | $5,017 | $421,762 | $139,816 | $281,946 |
| 2017 | $4,895 | $413,493 | $137,075 | $276,418 |
| 2016 | $4,833 | $405,387 | $134,388 | $270,999 |
| 2015 | $4,679 | $399,299 | $132,370 | $266,929 |
| 2014 | $4,218 | $366,000 | $121,000 | $245,000 |
Source: Public Records
Map
Nearby Homes
- 2828 Coleman Glen Ln
- 2863 Liscum St
- 2778 Coleman Glen Ln
- 2622 Arrowhead Dr
- 2630 Arrowhead Dr
- 2931 Liscum St
- 2766 Sassy St
- 2794 Sassy St
- 2790 Sassy St
- 2912 Liscum St
- 2786 Sassy St
- 2778 Sassy St
- 2928 Liscum St
- 2779 Sassy St
- 2771 Sassy St
- Plan 2 at Grove Village
- Plan 4 at Grove Village
- Plan 5 at Grove Village
- Plan 1 at Grove Village
- Plan 6 at Grove Village
- 2636 Barndance Ln
- 2644 Barndance Ln
- 2763 Bella Cir
- 2648 Barndance Ln
- 2759 Bella Cir
- 2767 Bella Cir
- 2645 Barndance Ln
- 2641 Barndance Ln
- 2771 Bella Cir
- 2628 Barndance Ln
- 2652 Barndance Ln
- 2751 Bella Cir
- 2649 Barndance Ln
- 2637 Barndance Ln
- 2653 Barndance Ln
- 2775 Bella Cir
- 2633 Barndance Ln
- 2747 Bella Cir
- 2656 Barndance Ln
- 2624 Barndance Ln