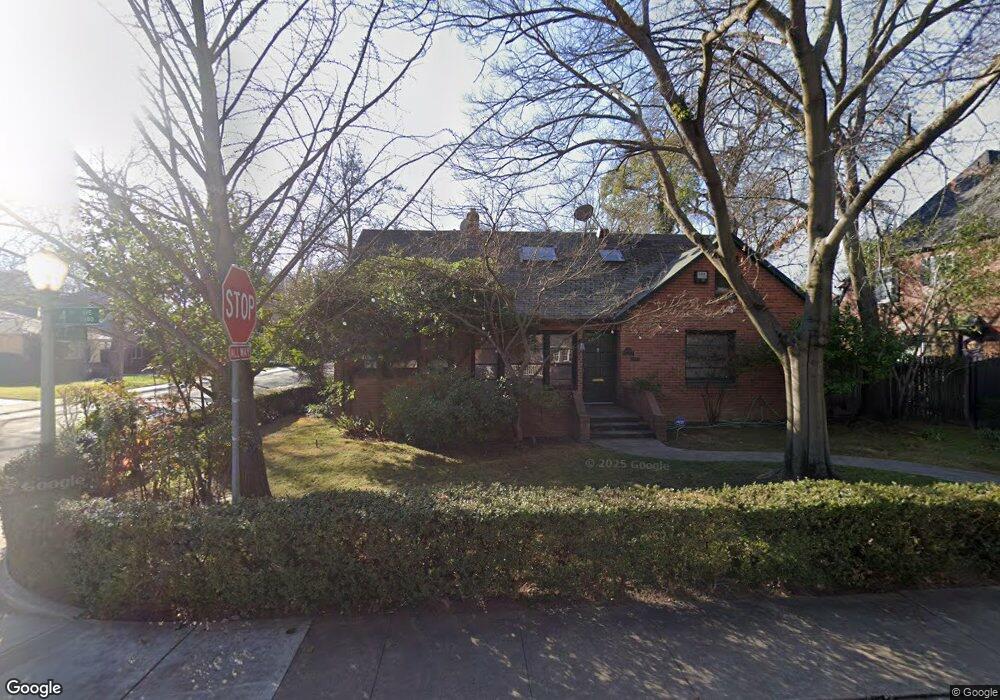
2648 4th Ave Sacramento, CA 95818
Curtis Park NeighborhoodEstimated Value: $780,000 - $856,000
4
Beds
2
Baths
1,807
Sq Ft
$447/Sq Ft
Est. Value
About This Home
This home is located at 2648 4th Ave, Sacramento, CA 95818 and is currently estimated at $807,187, approximately $446 per square foot. 2648 4th Ave is a home located in Sacramento County with nearby schools including Bret Harte Elementary School, California Middle, and C. K. McClatchy High.
Ownership History
Date
Name
Owned For
Owner Type
Purchase Details
Closed on
Feb 24, 2025
Sold by
Lacornu-Smith Cheryl A
Bought by
Cheryl La Cornu Trust and La Cornu-Smith
Current Estimated Value
Purchase Details
Closed on
Sep 23, 2009
Sold by
Smith James H and Smith La Cornu
Bought by
Lacornu Smith Cheryl A
Home Financials for this Owner
Home Financials are based on the most recent Mortgage that was taken out on this home.
Original Mortgage
$268,500
Interest Rate
5.08%
Mortgage Type
New Conventional
Purchase Details
Closed on
Jun 10, 2003
Sold by
Smith James H and Lacornu Smith Cheryl A
Bought by
Smith James H and Lacornu Smith Cheryl A
Home Financials for this Owner
Home Financials are based on the most recent Mortgage that was taken out on this home.
Original Mortgage
$312,700
Interest Rate
5.61%
Mortgage Type
Purchase Money Mortgage
Purchase Details
Closed on
Dec 24, 2002
Sold by
Smith James H and Lacornu Smith Cheryl A
Bought by
Smith James H and Lacornu Smith Cheryl A
Purchase Details
Closed on
Oct 29, 2001
Sold by
Smith James H and Lacornu Smith Cheryl A
Bought by
Smith James H and Smith La Cornu
Home Financials for this Owner
Home Financials are based on the most recent Mortgage that was taken out on this home.
Original Mortgage
$316,000
Interest Rate
6.73%
Purchase Details
Closed on
Apr 21, 1999
Sold by
Smith James H and Smith Cheryl A
Bought by
Smith James H and Lacornu Smith Cheryl A
Purchase Details
Closed on
Jul 26, 1995
Sold by
Shanks Robert F and Shanks Jo Ellen O
Bought by
Smith James H and Lacornu Smith Cheryl A
Home Financials for this Owner
Home Financials are based on the most recent Mortgage that was taken out on this home.
Original Mortgage
$196,860
Interest Rate
7.62%
Mortgage Type
Assumption
Create a Home Valuation Report for This Property
The Home Valuation Report is an in-depth analysis detailing your home's value as well as a comparison with similar homes in the area
Home Values in the Area
Average Home Value in this Area
Purchase History
| Date | Buyer | Sale Price | Title Company |
|---|---|---|---|
| Cheryl La Cornu Trust | -- | None Listed On Document | |
| Cheryl La Cornu Trust | -- | None Listed On Document | |
| Lacornu Smith Cheryl A | -- | Old Republic Title Company | |
| Smith James H | -- | Financial Title Company | |
| Smith James H | -- | Financial Title Company | |
| Smith James H | -- | Financial Title Company | |
| Smith James H | -- | Financial Title Company | |
| Smith James H | -- | Financial Title Company | |
| Smith James H | -- | Financial Title Company | |
| Smith James H | -- | Financial Title Company | |
| Smith James H | $193,500 | Old Republic Title Company |
Source: Public Records
Mortgage History
| Date | Status | Borrower | Loan Amount |
|---|---|---|---|
| Previous Owner | Lacornu Smith Cheryl A | $268,500 | |
| Previous Owner | Smith James H | $312,700 | |
| Previous Owner | Smith James H | $316,000 | |
| Previous Owner | Smith James H | $196,860 |
Source: Public Records
Tax History Compared to Growth
Tax History
| Year | Tax Paid | Tax Assessment Tax Assessment Total Assessment is a certain percentage of the fair market value that is determined by local assessors to be the total taxable value of land and additions on the property. | Land | Improvement |
|---|---|---|---|---|
| 2025 | $3,854 | $321,424 | $116,273 | $205,151 |
| 2024 | $3,854 | $315,123 | $113,994 | $201,129 |
| 2023 | $3,762 | $308,945 | $111,759 | $197,186 |
| 2022 | $3,697 | $302,888 | $109,568 | $193,320 |
| 2021 | $3,525 | $296,950 | $107,420 | $189,530 |
| 2020 | $3,550 | $293,906 | $106,319 | $187,587 |
| 2019 | $3,475 | $288,144 | $104,235 | $183,909 |
| 2018 | $3,384 | $282,495 | $102,192 | $180,303 |
| 2017 | $3,337 | $276,957 | $100,189 | $176,768 |
| 2016 | $3,225 | $271,527 | $98,225 | $173,302 |
| 2015 | $3,167 | $267,449 | $96,750 | $170,699 |
| 2014 | $3,082 | $262,211 | $94,855 | $167,356 |
Source: Public Records
Map
Nearby Homes