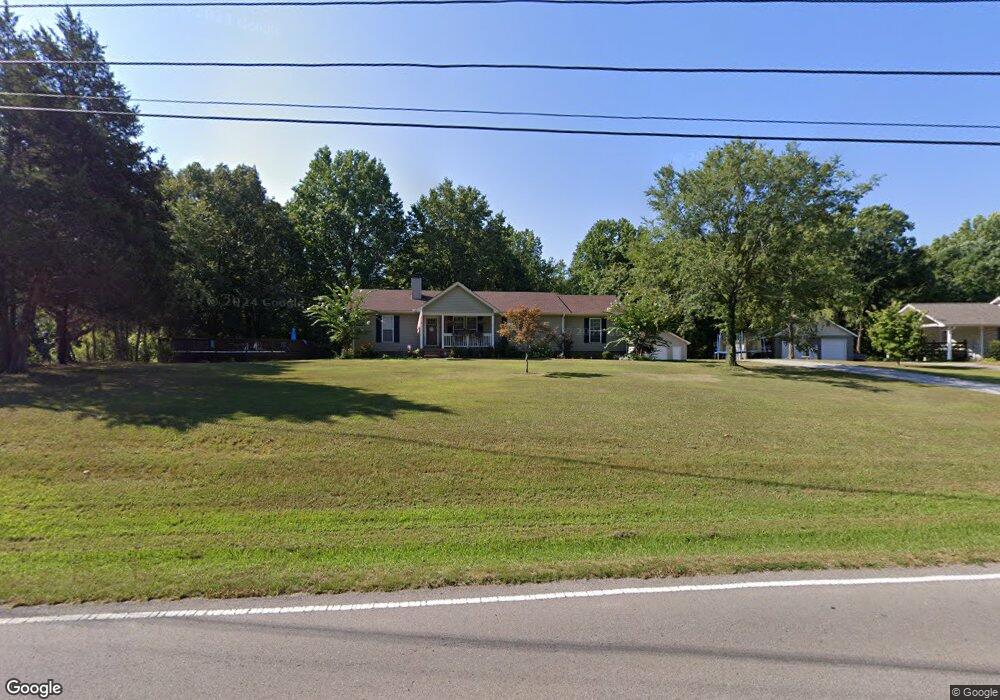
2649 Old Clarksville Pike Ashland City, TN 37015
Joelton NeighborhoodEstimated Value: $335,064 - $431,000
--
Bed
2
Baths
1,344
Sq Ft
$285/Sq Ft
Est. Value
About This Home
This home is located at 2649 Old Clarksville Pike, Ashland City, TN 37015 and is currently estimated at $382,766, approximately $284 per square foot. 2649 Old Clarksville Pike is a home located in Cheatham County with nearby schools including East Cheatham Elementary School, Sycamore Middle School, and Sycamore High School.
Ownership History
Date
Name
Owned For
Owner Type
Purchase Details
Closed on
Jul 22, 2021
Sold by
Gobbell Marissa and Gobbell Robert
Bought by
Gobbell Marissa
Current Estimated Value
Home Financials for this Owner
Home Financials are based on the most recent Mortgage that was taken out on this home.
Original Mortgage
$196,671
Outstanding Balance
$178,530
Interest Rate
2.93%
Mortgage Type
FHA
Estimated Equity
$204,236
Purchase Details
Closed on
May 31, 2005
Sold by
Law John
Bought by
Law John Marissa
Purchase Details
Closed on
Jan 23, 2003
Sold by
Rinehart George L
Bought by
Law John
Home Financials for this Owner
Home Financials are based on the most recent Mortgage that was taken out on this home.
Original Mortgage
$113,680
Interest Rate
5.98%
Purchase Details
Closed on
May 31, 1996
Sold by
Mccanless Jack S
Bought by
Rinehart George and Rinehart Natalie
Create a Home Valuation Report for This Property
The Home Valuation Report is an in-depth analysis detailing your home's value as well as a comparison with similar homes in the area
Home Values in the Area
Average Home Value in this Area
Purchase History
| Date | Buyer | Sale Price | Title Company |
|---|---|---|---|
| Gobbell Marissa | -- | Elevated Title | |
| Law John Marissa | -- | -- | |
| Law John | $122,000 | -- | |
| Rinehart George | $92,900 | -- |
Source: Public Records
Mortgage History
| Date | Status | Borrower | Loan Amount |
|---|---|---|---|
| Open | Gobbell Marissa | $196,671 | |
| Previous Owner | Rinehart George | $113,680 |
Source: Public Records
Tax History Compared to Growth
Tax History
| Year | Tax Paid | Tax Assessment Tax Assessment Total Assessment is a certain percentage of the fair market value that is determined by local assessors to be the total taxable value of land and additions on the property. | Land | Improvement |
|---|---|---|---|---|
| 2024 | $1,499 | $86,575 | $17,050 | $69,525 |
| 2023 | $1,461 | $51,325 | $6,075 | $45,250 |
| 2022 | $1,381 | $51,325 | $6,075 | $45,250 |
| 2021 | $1,381 | $51,325 | $6,075 | $45,250 |
| 2020 | $1,261 | $46,850 | $6,075 | $40,775 |
| 2019 | $1,261 | $46,850 | $6,075 | $40,775 |
| 2018 | $1,242 | $39,550 | $4,275 | $35,275 |
| 2017 | $1,175 | $39,550 | $4,275 | $35,275 |
| 2016 | $1,118 | $39,550 | $4,275 | $35,275 |
| 2015 | $1,009 | $33,425 | $4,275 | $29,150 |
| 2014 | $1,009 | $33,425 | $4,275 | $29,150 |
Source: Public Records
Map
Nearby Homes
- 283 Lady Ln
- 398 Frontier Ln
- 1462 Peter Pond Rd
- 1374 Peter Pond Rd
- 1206 Sycamore Valley Rd
- 1323 Mount Zion Rd
- 1242 Peter Pond Rd
- 2143 Blue Springs Rd
- 1104 Golf Course Ln
- 1182 Mount Zion Rd
- 1020 Golf Course Ln
- 1509 Highway 49 E
- 0 W Side Rd Unit RTC2756551
- 1037 Boston Hollow Rd
- 2504 Bearwallow Rd
- 312 Powder Mill Dr
- 1021 Tulip Dr
- 1147 Bearwallow Rd
- 1248 Leaf Ln
- 1417 Rooster Ridge Rd
- 2651 Old Clarksville Pike
- 2647 Old Clarksville Pike
- 2653 Old Clarksville Pike
- 2652 Old Clarksville Pike
- 1003 Shannon Ln
- 2635 Old Clarksville Pike
- 2644 Old Clarksville Pike
- 2655 Old Clarksville Pike
- 0 Shannon Ln
- 2640 Old Clarksville Pike
- 1005 Shannon Ln
- 2633 Old Clarksville Pike
- 2657 Old Clarksville Pike
- 1004 Shannon Ln
- 1001 Pursley Rd
- 1009 Shannon Ln
- 2631 Old Clarksville Pike
- 149 Action Ln
- 1747 Carney Winters Rd
- 1019 Bruce Binkley Rd