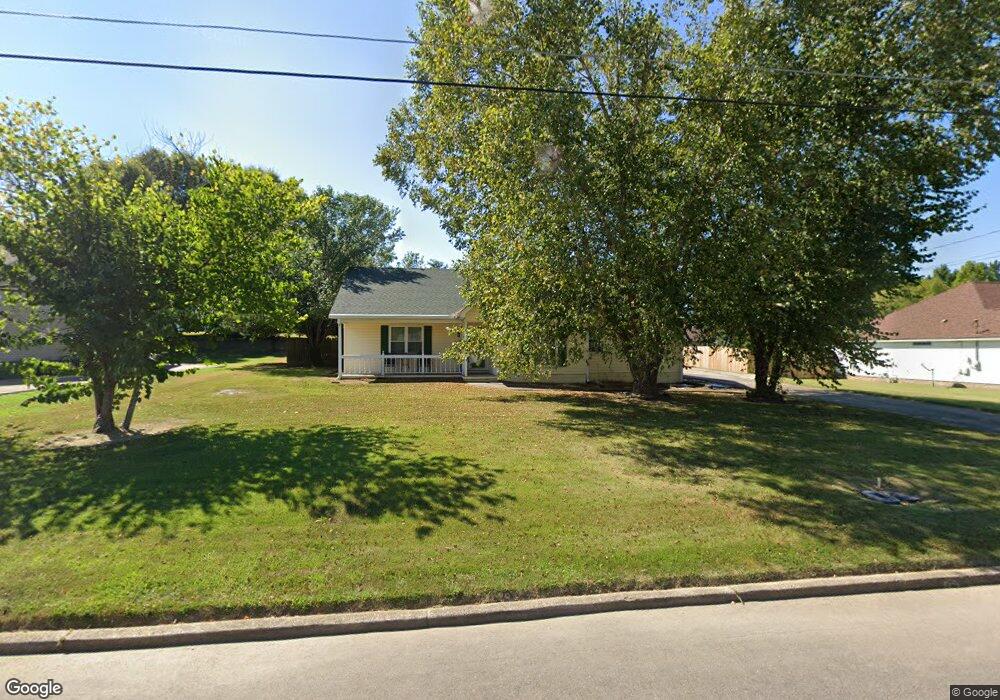
265 Collins St Ripley, TN 38063
Estimated Value: $218,659 - $245,000
--
Bed
2
Baths
1,754
Sq Ft
$131/Sq Ft
Est. Value
About This Home
This home is located at 265 Collins St, Ripley, TN 38063 and is currently estimated at $229,165, approximately $130 per square foot. 265 Collins St is a home located in Lauderdale County with nearby schools including Ripley Primary School, Ripley Elementary School, and Ripley Middle School.
Ownership History
Date
Name
Owned For
Owner Type
Purchase Details
Closed on
May 14, 2007
Sold by
Kenney Smith
Bought by
Davis William H
Current Estimated Value
Home Financials for this Owner
Home Financials are based on the most recent Mortgage that was taken out on this home.
Original Mortgage
$111,510
Outstanding Balance
$67,496
Interest Rate
6.17%
Mortgage Type
Cash
Estimated Equity
$161,669
Purchase Details
Closed on
Oct 20, 1993
Bought by
Schneider Angela S
Purchase Details
Closed on
Jun 15, 1989
Bought by
Naber Ibrahim
Create a Home Valuation Report for This Property
The Home Valuation Report is an in-depth analysis detailing your home's value as well as a comparison with similar homes in the area
Home Values in the Area
Average Home Value in this Area
Purchase History
| Date | Buyer | Sale Price | Title Company |
|---|---|---|---|
| Davis William H | $123,900 | -- | |
| Schneider Angela S | $7,500 | -- | |
| Naber Ibrahim | -- | -- |
Source: Public Records
Mortgage History
| Date | Status | Borrower | Loan Amount |
|---|---|---|---|
| Open | Naber Ibrahim | $111,510 |
Source: Public Records
Tax History Compared to Growth
Tax History
| Year | Tax Paid | Tax Assessment Tax Assessment Total Assessment is a certain percentage of the fair market value that is determined by local assessors to be the total taxable value of land and additions on the property. | Land | Improvement |
|---|---|---|---|---|
| 2025 | $754 | $29,675 | $0 | $0 |
| 2024 | $754 | $29,675 | $2,200 | $27,475 |
| 2023 | $1,496 | $29,675 | $2,200 | $27,475 |
| 2022 | $1,496 | $29,675 | $2,200 | $27,475 |
| 2021 | $1,432 | $29,675 | $2,200 | $27,475 |
| 2020 | $1,448 | $29,675 | $2,200 | $27,475 |
| 2019 | $1,448 | $26,300 | $2,750 | $23,550 |
| 2018 | $1,448 | $26,300 | $2,750 | $23,550 |
| 2017 | $1,413 | $26,300 | $2,750 | $23,550 |
| 2016 | $1,358 | $26,300 | $2,750 | $23,550 |
| 2015 | $1,379 | $26,300 | $2,750 | $23,550 |
| 2014 | $818 | $28,200 | $2,750 | $25,450 |
Source: Public Records
Map
Nearby Homes
- 319 Jordan St
- 187 Collins St
- 0 Naber St
- 0 Collins St
- 158 Barry White Ln
- 45 Village Ave
- 108 Walnut Ridge
- 109 Walnut Ridge
- 738 American Way
- 100 Raven Hill Ln
- 102 Stone Brook Cove
- 103 Stone Brook Cove
- 107 Stone Brook Cove
- 059 York Commons
- 060 York Commons
- 51 York Commons
- 51,52,55,56 York Commons
- 3854 Edith-Nankipoo Rd
- 2440 Edith Nankipoo Rd
- 112 York Commons