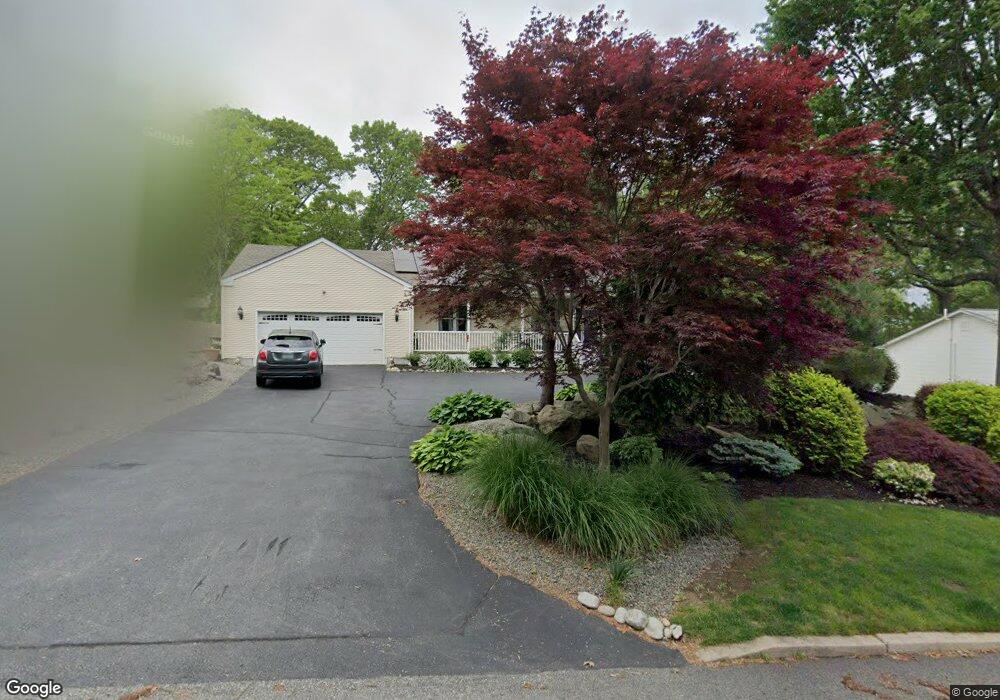
265 Elena St Cranston, RI 02920
Thornton NeighborhoodEstimated Value: $516,000 - $591,000
3
Beds
3
Baths
2,402
Sq Ft
$232/Sq Ft
Est. Value
About This Home
This home is located at 265 Elena St, Cranston, RI 02920 and is currently estimated at $558,006, approximately $232 per square foot. 265 Elena St is a home located in Providence County with nearby schools including Stone Hill School, Western Hills Middle School, and Cranston High School West.
Ownership History
Date
Name
Owned For
Owner Type
Purchase Details
Closed on
Oct 11, 2017
Sold by
David Goerge
Bought by
David Michelle
Current Estimated Value
Home Financials for this Owner
Home Financials are based on the most recent Mortgage that was taken out on this home.
Original Mortgage
$325,000
Outstanding Balance
$271,398
Interest Rate
3.9%
Mortgage Type
FHA
Estimated Equity
$286,608
Purchase Details
Closed on
Apr 10, 1998
Sold by
Branca Rudloph G and Branca Alesandra
Bought by
David George T and David Michelle
Create a Home Valuation Report for This Property
The Home Valuation Report is an in-depth analysis detailing your home's value as well as a comparison with similar homes in the area
Home Values in the Area
Average Home Value in this Area
Purchase History
| Date | Buyer | Sale Price | Title Company |
|---|---|---|---|
| David Michelle | -- | -- | |
| David George T | $62,500 | -- |
Source: Public Records
Mortgage History
| Date | Status | Borrower | Loan Amount |
|---|---|---|---|
| Open | David George T | $325,000 | |
| Previous Owner | David George T | $278,225 |
Source: Public Records
Tax History Compared to Growth
Tax History
| Year | Tax Paid | Tax Assessment Tax Assessment Total Assessment is a certain percentage of the fair market value that is determined by local assessors to be the total taxable value of land and additions on the property. | Land | Improvement |
|---|---|---|---|---|
| 2025 | $7,064 | $508,900 | $129,900 | $379,000 |
| 2024 | $6,926 | $508,900 | $129,900 | $379,000 |
| 2023 | $7,023 | $371,600 | $89,500 | $282,100 |
| 2022 | $6,878 | $371,600 | $89,500 | $282,100 |
| 2021 | $6,689 | $371,600 | $89,500 | $282,100 |
| 2020 | $6,418 | $309,000 | $93,800 | $215,200 |
| 2019 | $6,418 | $309,000 | $93,800 | $215,200 |
| 2018 | $6,270 | $309,000 | $93,800 | $215,200 |
| 2017 | $5,776 | $251,800 | $85,300 | $166,500 |
| 2016 | $5,653 | $251,800 | $85,300 | $166,500 |
| 2015 | $5,653 | $251,800 | $85,300 | $166,500 |
| 2014 | $5,594 | $244,900 | $85,300 | $159,600 |
Source: Public Records
Map
Nearby Homes