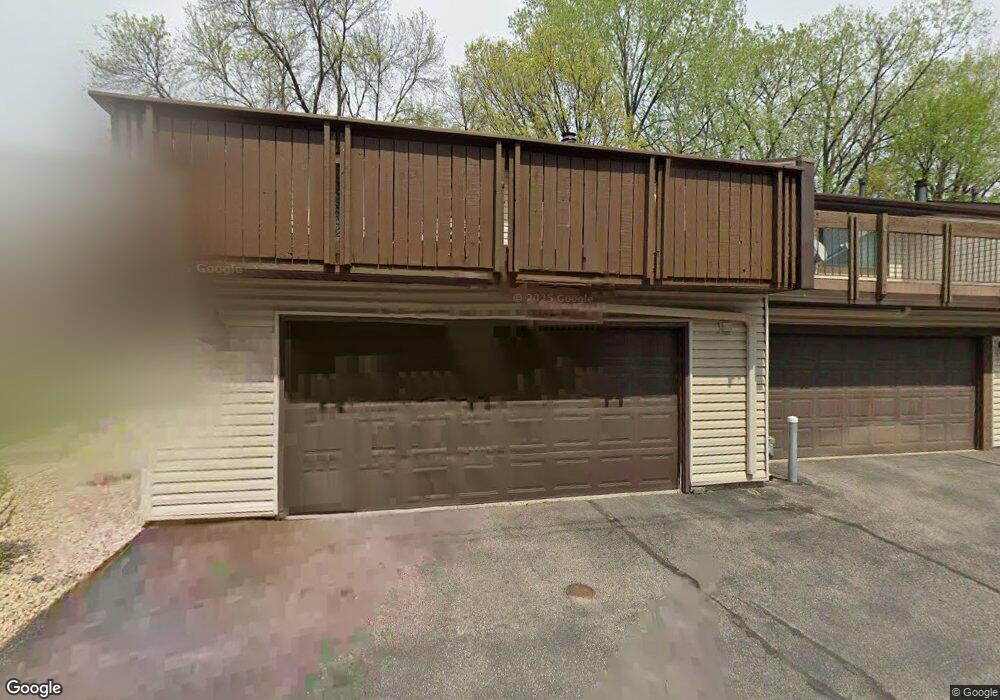
265 River Woods Ln Burnsville, MN 55337
Estimated Value: $250,000 - $274,975
3
Beds
2
Baths
1,928
Sq Ft
$138/Sq Ft
Est. Value
About This Home
This home is located at 265 River Woods Ln, Burnsville, MN 55337 and is currently estimated at $265,994, approximately $137 per square foot. 265 River Woods Ln is a home located in Dakota County with nearby schools including William Byrne Elementary School, Burnsville High School, and Gateway STEM Academy.
Ownership History
Date
Name
Owned For
Owner Type
Purchase Details
Closed on
Dec 22, 2021
Sold by
Homeprid Inc
Bought by
Salter Adam and Salter Amy
Current Estimated Value
Home Financials for this Owner
Home Financials are based on the most recent Mortgage that was taken out on this home.
Original Mortgage
$250,800
Outstanding Balance
$230,670
Interest Rate
3.11%
Mortgage Type
New Conventional
Estimated Equity
$35,324
Purchase Details
Closed on
Aug 18, 2021
Sold by
Obregon Annette M
Bought by
Renovation Group Inc
Purchase Details
Closed on
May 1, 2015
Sold by
Obregon Annette M
Bought by
Blue Sky Services Llc
Purchase Details
Closed on
Aug 24, 2010
Sold by
Mcnair Kevin W and Mcnair Tricia
Bought by
Obregon Annette M
Purchase Details
Closed on
Aug 23, 1996
Sold by
Pfalzgraf Lavere A and Pfalzgraf Ellen K
Bought by
Taylor Clara Jo
Create a Home Valuation Report for This Property
The Home Valuation Report is an in-depth analysis detailing your home's value as well as a comparison with similar homes in the area
Home Values in the Area
Average Home Value in this Area
Purchase History
| Date | Buyer | Sale Price | Title Company |
|---|---|---|---|
| Salter Adam | $264,000 | The Title Group Inc | |
| Renovation Group Inc | $5,000 | None Available | |
| Blue Sky Services Llc | $11,100 | None Available | |
| Obregon Annette M | $170,000 | -- | |
| Taylor Clara Jo | $87,900 | -- | |
| -- | $5,000 | -- |
Source: Public Records
Mortgage History
| Date | Status | Borrower | Loan Amount |
|---|---|---|---|
| Open | Salter Adam | $250,800 |
Source: Public Records
Tax History Compared to Growth
Tax History
| Year | Tax Paid | Tax Assessment Tax Assessment Total Assessment is a certain percentage of the fair market value that is determined by local assessors to be the total taxable value of land and additions on the property. | Land | Improvement |
|---|---|---|---|---|
| 2024 | $2,660 | $248,300 | $43,900 | $204,400 |
| 2023 | $2,660 | $252,800 | $44,000 | $208,800 |
| 2022 | $2,320 | $247,000 | $43,800 | $203,200 |
| 2021 | $2,248 | $215,300 | $38,100 | $177,200 |
| 2020 | $2,142 | $197,600 | $33,700 | $163,900 |
| 2019 | $2,223 | $181,400 | $32,100 | $149,300 |
| 2018 | $2,038 | $178,800 | $29,700 | $149,100 |
| 2017 | $1,970 | $159,000 | $27,500 | $131,500 |
| 2016 | $1,860 | $150,600 | $26,200 | $124,400 |
| 2015 | $1,643 | $136,400 | $25,400 | $111,000 |
| 2014 | -- | $126,000 | $23,900 | $102,100 |
| 2013 | -- | $107,100 | $21,200 | $85,900 |
Source: Public Records
Map
Nearby Homes
- 247 River Woods Ln
- 319 River Woods Ln
- 221 River Woods Ln
- 188 River Woods Ln
- 146 River Woods Ln
- 145 River Woods Ln
- 4774 Slater Rd
- 3309 Red Oak Cir N
- 4632 Westwood Ln
- 55 River Woods Ln
- 72 River Woods Ln
- 11902 River Hills Cir
- 12625 Sable Dr
- 11921 Baypoint Dr
- 12640 Tiffany Ct
- 2107 Kings Rd
- 2100 Viburnum Trail
- 11900 Highland View Cir
- 2065 Kings Rd
- 2400 E 125th St
- 264 River Woods Ln
- 262 River Woods Ln
- 267 River Woods Ln
- 268 River Woods Ln
- 266 River Woods Ln
- 269 River Woods Ln
- 259 River Woods Ln
- 258 River Woods Ln
- 260 River Woods Ln
- 261 River Woods Ln
- 272 River Woods Ln
- 271 River Woods Ln
- 273 River Woods Ln
- 270 River Woods Ln
- 4813 Four Seasons Dr
- 230 River Woods Ln
- 4809 Four Seasons Dr
- 241 River Woods Ln
- 231 River Woods Ln
- 240 River Woods Ln