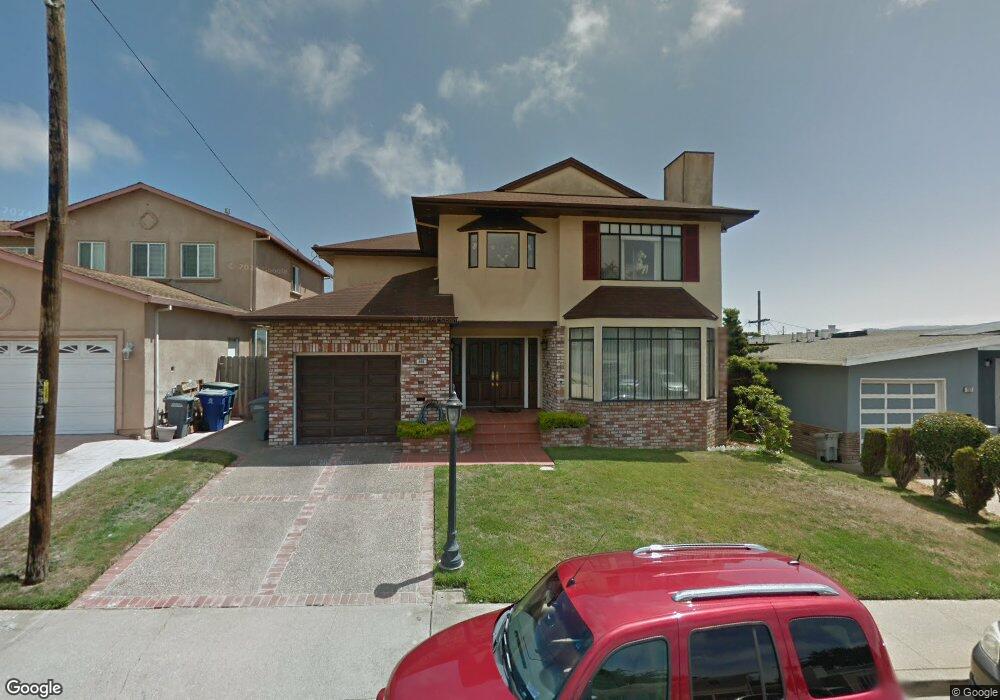
266 Holly Ave South San Francisco, CA 94080
Sunshine Gardens NeighborhoodEstimated Value: $1,160,000 - $1,423,000
3
Beds
3
Baths
2,400
Sq Ft
$526/Sq Ft
Est. Value
About This Home
This home is located at 266 Holly Ave, South San Francisco, CA 94080 and is currently estimated at $1,262,372, approximately $525 per square foot. 266 Holly Ave is a home located in San Mateo County with nearby schools including Sunshine Gardens Elementary School, Parkway Heights Middle School, and El Camino High School.
Ownership History
Date
Name
Owned For
Owner Type
Purchase Details
Closed on
Oct 12, 2018
Sold by
Marchi Henry and Marchi Barbara
Bought by
Marchi Henry and Marchi Barbara
Current Estimated Value
Home Financials for this Owner
Home Financials are based on the most recent Mortgage that was taken out on this home.
Original Mortgage
$2,175,000
Interest Rate
4.5%
Mortgage Type
Reverse Mortgage Home Equity Conversion Mortgage
Purchase Details
Closed on
Nov 23, 2004
Sold by
Marchi Henry and Marchi Barbara
Bought by
Marchi Henry and Marchi Barbara
Home Financials for this Owner
Home Financials are based on the most recent Mortgage that was taken out on this home.
Original Mortgage
$562,500
Interest Rate
4.95%
Mortgage Type
Negative Amortization
Purchase Details
Closed on
Feb 2, 2000
Sold by
Marchi Henry A and Jean Barbara
Bought by
Marchi Henry and Marchi Barbara
Create a Home Valuation Report for This Property
The Home Valuation Report is an in-depth analysis detailing your home's value as well as a comparison with similar homes in the area
Home Values in the Area
Average Home Value in this Area
Purchase History
| Date | Buyer | Sale Price | Title Company |
|---|---|---|---|
| Marchi Henry | -- | None Available | |
| Marchi Henry | -- | First American Title Company | |
| Marchi Henry | -- | First American Title Co | |
| Marchi Henry | -- | -- |
Source: Public Records
Mortgage History
| Date | Status | Borrower | Loan Amount |
|---|---|---|---|
| Closed | Marchi Henry | $2,175,000 | |
| Closed | Marchi Henry | $562,500 |
Source: Public Records
Tax History Compared to Growth
Tax History
| Year | Tax Paid | Tax Assessment Tax Assessment Total Assessment is a certain percentage of the fair market value that is determined by local assessors to be the total taxable value of land and additions on the property. | Land | Improvement |
|---|---|---|---|---|
| 2025 | $2,753 | $176,752 | $21,612 | $155,140 |
| 2023 | $2,753 | $169,891 | $20,774 | $149,117 |
| 2022 | $2,565 | $166,561 | $20,367 | $146,194 |
| 2021 | $2,527 | $163,296 | $19,968 | $143,328 |
| 2020 | $2,493 | $161,623 | $19,764 | $141,859 |
| 2019 | $2,473 | $158,455 | $19,377 | $139,078 |
| 2018 | $2,343 | $155,349 | $18,998 | $136,351 |
| 2017 | $2,250 | $152,304 | $18,626 | $133,678 |
| 2016 | $2,146 | $149,318 | $18,261 | $131,057 |
| 2015 | $2,108 | $147,076 | $17,987 | $129,089 |
| 2014 | $2,054 | $144,196 | $17,635 | $126,561 |
Source: Public Records
Map
Nearby Homes
- 252 Sequoia Ave
- 1488 El Camino Real Unit 211
- 467 Holly Ave
- 829 Stonegate Dr
- 889 Mclellan Dr Unit 205
- 889 Mclellan Dr Unit 302
- 0 Indio Dr
- 729 Grand Ave
- 728 Cottonwood Ave
- 719 Circle Ct
- 1700 El Camino Real Unit 2-03
- 1700 El Camino Real
- 645 Baden Ave Unit 4
- 69 Windcrest Ln
- 121 Northcrest Dr
- 632 1st Ln
- 311 Magnolia Ave
- 556 Keoncrest Dr
- 577 Miller Ave
- 706 Serra Dr