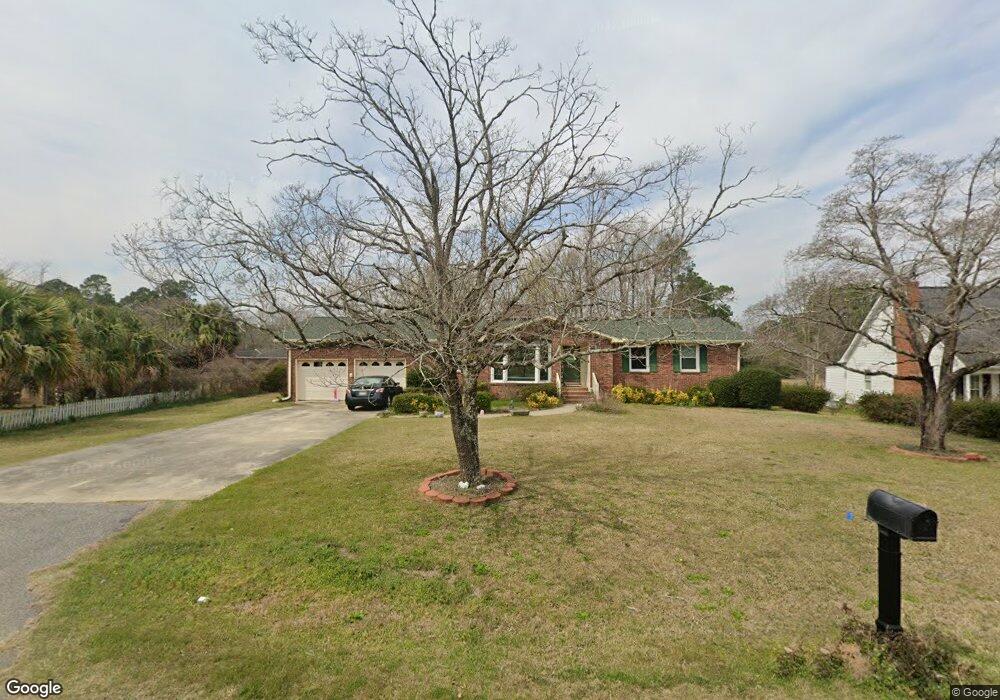
2665 Hillcrest Ave Orangeburg, SC 29118
Estimated Value: $207,000 - $245,165
3
Beds
2
Baths
2,016
Sq Ft
$109/Sq Ft
Est. Value
About This Home
This home is located at 2665 Hillcrest Ave, Orangeburg, SC 29118 and is currently estimated at $219,291, approximately $108 per square foot. 2665 Hillcrest Ave is a home located in Orangeburg County with nearby schools including Marshall Elementary School, Marshall Elementary, and William J. Clark Middle School.
Ownership History
Date
Name
Owned For
Owner Type
Purchase Details
Closed on
May 10, 2019
Sold by
Barksdale Elaine F
Bought by
Davis Fatimah
Current Estimated Value
Home Financials for this Owner
Home Financials are based on the most recent Mortgage that was taken out on this home.
Original Mortgage
$126,262
Outstanding Balance
$110,557
Interest Rate
4%
Mortgage Type
New Conventional
Estimated Equity
$108,734
Purchase Details
Closed on
Dec 3, 2014
Sold by
Ray John D
Bought by
Barksdale Elaine F and Ray John D
Purchase Details
Closed on
Aug 20, 2010
Sold by
Ray John D and Ray Adeline S
Bought by
Ray John D and Ray Adeline S
Purchase Details
Closed on
Feb 10, 2006
Sold by
Holman Woodrow C
Bought by
Ray John D and Ray Adeline S
Purchase Details
Closed on
Aug 5, 2005
Sold by
Lee Jessie C and Lee John W
Bought by
Holman Woodrow C
Create a Home Valuation Report for This Property
The Home Valuation Report is an in-depth analysis detailing your home's value as well as a comparison with similar homes in the area
Home Values in the Area
Average Home Value in this Area
Purchase History
| Date | Buyer | Sale Price | Title Company |
|---|---|---|---|
| Davis Fatimah | $125,000 | First American Mortgage Sln | |
| Barksdale Elaine F | -- | -- | |
| Ray John D | -- | -- | |
| Ray John D | $110,000 | None Available | |
| Holman Woodrow C | $94,000 | -- |
Source: Public Records
Mortgage History
| Date | Status | Borrower | Loan Amount |
|---|---|---|---|
| Open | Davis Fatimah | $126,262 |
Source: Public Records
Tax History Compared to Growth
Tax History
| Year | Tax Paid | Tax Assessment Tax Assessment Total Assessment is a certain percentage of the fair market value that is determined by local assessors to be the total taxable value of land and additions on the property. | Land | Improvement |
|---|---|---|---|---|
| 2024 | $1,836 | $8,181 | $845 | $7,336 |
| 2023 | $1,640 | $5,625 | $805 | $4,820 |
| 2022 | $1,528 | $5,625 | $805 | $4,820 |
| 2021 | $1,516 | $5,625 | $805 | $4,820 |
| 2020 | $1,494 | $5,625 | $805 | $4,820 |
| 2019 | $3,754 | $8,437 | $0 | $0 |
| 2018 | $877 | $5,445 | $805 | $4,640 |
| 2017 | $842 | $5,445 | $0 | $0 |
| 2016 | $843 | $5,445 | $0 | $0 |
| 2015 | $492 | $5,445 | $0 | $0 |
| 2014 | $492 | $5,445 | $805 | $4,640 |
| 2013 | -- | $5,769 | $805 | $4,964 |
Source: Public Records
Map
Nearby Homes
- 2136 Pinnacle St
- 2753 Hillcrest St NE
- 2753 Hillcrest Ave
- 00 Riley St
- 0 Riley St
- 2415 Riley St
- 2778 Riley St
- 2220 Hillside St
- 2220 Hillside St NE
- 2395 Lakeside St
- 2251 Hillcrest Ave Unit 6C
- 2354 Northview Dr Unit 2A
- 2358 Northview Dr Unit 2B
- 2336 Northview Dr Unit 3-C
- 2348 Northview Dr Unit 3F
- 2320 Mall Terrace Ct Unit 2320
- 2069 Hydrick Ave
- 2160 Chestnut St
- 336 Young Town Cir
- 312 Young Town Cir
- 2697 Hillcrest Ave
- 2633 Hillcrest Ave
- 2633 Hillcrest Ave
- 2633 Hillcrest Ave
- 2123 Skyland Ln
- 2147 Skyland Ln
- 2692 Hillcrest Ave
- 2192 Pinnacle St
- 2648 Hillcrest Ave
- 2593 Pinnacle St
- 2171 Skyland Ln
- 2712 Hillcrest Ave
- 2598 Hillcrest Ave
- 2063 Skyland Ln
- 2715 Hillcrest Ave
- 2066 Skyland Ln
- 2127 Pinnacle St
- 2620 Lakeside St
- 2571 Hillcrest Ave
- 2143 Pinnacle St