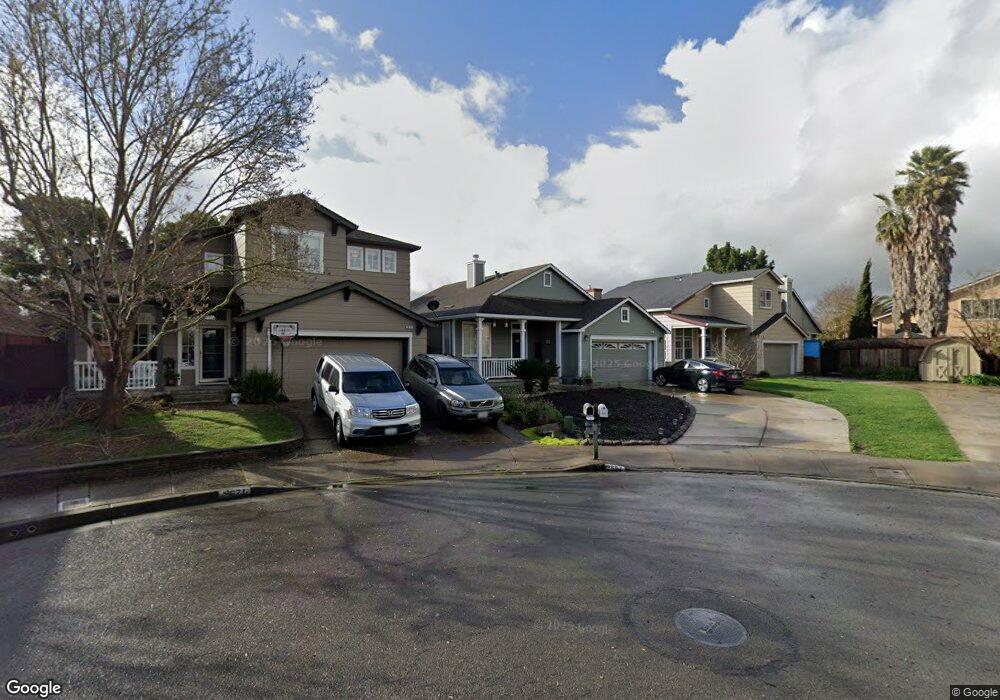
2667 Wild Bill Cir Santa Rosa, CA 95407
Estimated Value: $589,631 - $701,000
3
Beds
2
Baths
1,157
Sq Ft
$555/Sq Ft
Est. Value
About This Home
This home is located at 2667 Wild Bill Cir, Santa Rosa, CA 95407 and is currently estimated at $641,658, approximately $554 per square foot. 2667 Wild Bill Cir is a home located in Sonoma County with nearby schools including Elsie Allen High School and St. Michael's Orthodox School.
Ownership History
Date
Name
Owned For
Owner Type
Purchase Details
Closed on
Oct 27, 2003
Sold by
Mora Norberto
Bought by
Gomez Miriam M
Current Estimated Value
Home Financials for this Owner
Home Financials are based on the most recent Mortgage that was taken out on this home.
Original Mortgage
$297,600
Outstanding Balance
$139,259
Interest Rate
6.25%
Mortgage Type
Purchase Money Mortgage
Estimated Equity
$502,399
Purchase Details
Closed on
Oct 16, 2003
Sold by
Bowling Ron
Bought by
Gomez Miriam
Home Financials for this Owner
Home Financials are based on the most recent Mortgage that was taken out on this home.
Original Mortgage
$297,600
Outstanding Balance
$139,259
Interest Rate
6.25%
Mortgage Type
Purchase Money Mortgage
Estimated Equity
$502,399
Purchase Details
Closed on
Jan 21, 2000
Sold by
Bellevue Ranch Associates Llc
Bought by
Bowling Ron
Home Financials for this Owner
Home Financials are based on the most recent Mortgage that was taken out on this home.
Original Mortgage
$154,100
Interest Rate
7.87%
Create a Home Valuation Report for This Property
The Home Valuation Report is an in-depth analysis detailing your home's value as well as a comparison with similar homes in the area
Home Values in the Area
Average Home Value in this Area
Purchase History
| Date | Buyer | Sale Price | Title Company |
|---|---|---|---|
| Gomez Miriam M | -- | Fidelity Natl Title Co | |
| Gomez Miriam | $372,000 | Fidelity Natl Title Co | |
| Bowling Ron | $193,000 | North American Title Co |
Source: Public Records
Mortgage History
| Date | Status | Borrower | Loan Amount |
|---|---|---|---|
| Open | Gomez Miriam | $297,600 | |
| Previous Owner | Bowling Ron | $154,100 | |
| Closed | Gomez Miriam | $74,400 |
Source: Public Records
Tax History Compared to Growth
Tax History
| Year | Tax Paid | Tax Assessment Tax Assessment Total Assessment is a certain percentage of the fair market value that is determined by local assessors to be the total taxable value of land and additions on the property. | Land | Improvement |
|---|---|---|---|---|
| 2025 | $6,014 | $528,886 | $213,261 | $315,625 |
| 2024 | $6,014 | $518,517 | $209,080 | $309,437 |
| 2023 | $6,014 | $508,351 | $204,981 | $303,370 |
| 2022 | $5,869 | $498,384 | $200,962 | $297,422 |
| 2021 | $5,805 | $488,613 | $197,022 | $291,591 |
| 2020 | $5,638 | $483,604 | $195,002 | $288,602 |
| 2019 | $5,568 | $474,123 | $191,179 | $282,944 |
| 2018 | $5,522 | $464,828 | $187,431 | $277,397 |
| 2017 | $5,152 | $436,000 | $176,000 | $260,000 |
| 2016 | $4,805 | $404,000 | $163,000 | $241,000 |
| 2015 | $4,181 | $358,000 | $144,000 | $214,000 |
| 2014 | $3,917 | $341,000 | $138,000 | $203,000 |
Source: Public Records
Map
Nearby Homes
- 2630 Arrowhead Dr
- 2632 Wild Bill Way
- 2599 Silver Spur Dr
- 2863 Liscum St
- 2912 Liscum St
- Plan 2 at Grove Village
- Plan 4 at Grove Village
- Plan 5 at Grove Village
- Plan 1 at Grove Village
- Plan 6 at Grove Village
- 2716 Amora Cir
- 2931 Liscum St
- 2928 Liscum St
- 2766 Sassy St
- 2778 Sassy St
- 1461 Trombetta St
- 2786 Sassy St
- 2790 Sassy St
- 2771 Sassy St
- 2779 Sassy St
- 2665 Wild Bill Cir
- 2671 Wild Bill Cir
- 2673 Wild Bill Cir
- 2021 Blacksmith Way
- 2663 Wild Bill Cir
- 2017 Blacksmith Way
- 2025 Blacksmith Way
- 2642 Arrowhead Dr
- 2011 Blacksmith Way
- 2640 Arrowhead Dr
- 2029 Blacksmith Way
- 2657 Wild Bill Cir
- 2651 Wild Bill Way
- 2638 Arrowhead Dr
- 2666 Wild Bill Cir
- 2653 Wild Bill Cir
- 2636 Arrowhead Dr
- 2670 Wild Bill Cir
- 2662 Wild Bill Cir