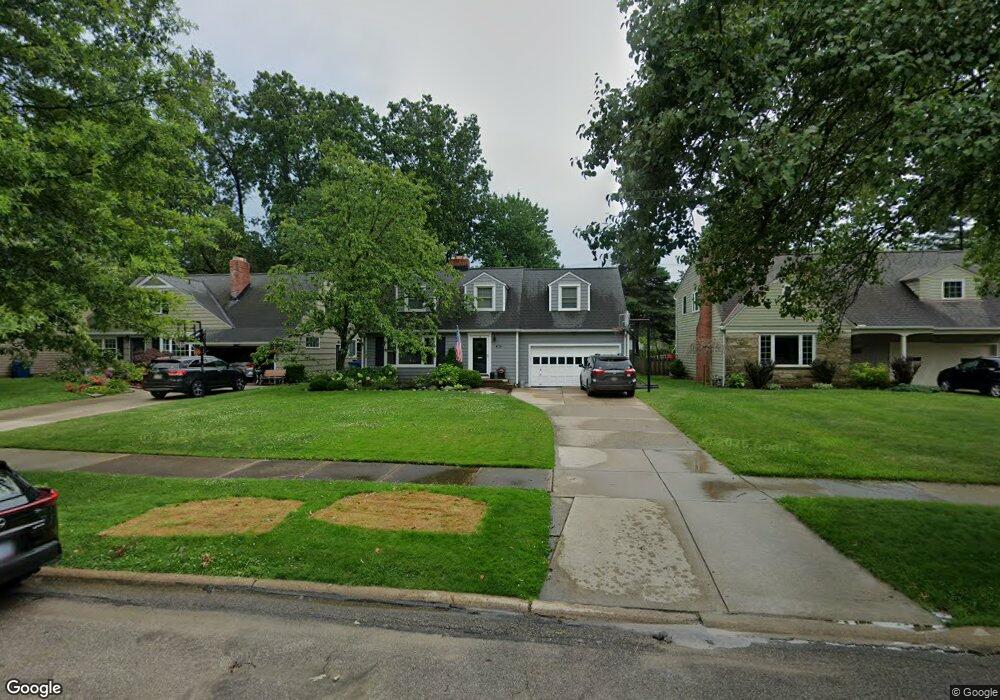
26711 Bruce Rd Bay Village, OH 44140
Estimated Value: $404,000 - $457,000
3
Beds
3
Baths
1,785
Sq Ft
$245/Sq Ft
Est. Value
About This Home
This home is located at 26711 Bruce Rd, Bay Village, OH 44140 and is currently estimated at $437,191, approximately $244 per square foot. 26711 Bruce Rd is a home located in Cuyahoga County with nearby schools including Normandy Elementary School, Westerly Elementary School, and Bay Middle School.
Ownership History
Date
Name
Owned For
Owner Type
Purchase Details
Closed on
Aug 8, 2007
Sold by
Petkovic Douglas and Petkovic Karen
Bought by
Colby Joseph Q and Colby Kelly S
Current Estimated Value
Home Financials for this Owner
Home Financials are based on the most recent Mortgage that was taken out on this home.
Original Mortgage
$201,875
Outstanding Balance
$128,013
Interest Rate
6.69%
Mortgage Type
Purchase Money Mortgage
Estimated Equity
$309,178
Purchase Details
Closed on
Oct 29, 2002
Sold by
Vonduhn Edgington Kathleen Rita and Edgington Victor
Bought by
Petkovic Douglas and Petkovic Karen
Home Financials for this Owner
Home Financials are based on the most recent Mortgage that was taken out on this home.
Original Mortgage
$183,350
Interest Rate
6.13%
Purchase Details
Closed on
Apr 3, 1990
Sold by
Chapman Edw E and Chapman Jaclyn K
Bought by
Duhn Mark Jon Von
Purchase Details
Closed on
Jan 1, 1975
Bought by
Chapman Edw E and Chapman Jaclyn K
Create a Home Valuation Report for This Property
The Home Valuation Report is an in-depth analysis detailing your home's value as well as a comparison with similar homes in the area
Home Values in the Area
Average Home Value in this Area
Purchase History
| Date | Buyer | Sale Price | Title Company |
|---|---|---|---|
| Colby Joseph Q | $237,500 | Barristers Title Agency | |
| Petkovic Douglas | $193,000 | Midland Title Security Inc | |
| Duhn Mark Jon Von | $136,000 | -- | |
| Chapman Edw E | -- | -- |
Source: Public Records
Mortgage History
| Date | Status | Borrower | Loan Amount |
|---|---|---|---|
| Open | Colby Joseph Q | $201,875 | |
| Closed | Petkovic Douglas | $183,350 |
Source: Public Records
Tax History Compared to Growth
Tax History
| Year | Tax Paid | Tax Assessment Tax Assessment Total Assessment is a certain percentage of the fair market value that is determined by local assessors to be the total taxable value of land and additions on the property. | Land | Improvement |
|---|---|---|---|---|
| 2024 | $9,080 | $133,980 | $27,825 | $106,155 |
| 2023 | $8,574 | $107,180 | $22,930 | $84,250 |
| 2022 | $8,534 | $107,170 | $22,930 | $84,250 |
| 2021 | $7,733 | $107,170 | $22,930 | $84,250 |
| 2020 | $7,167 | $89,320 | $19,110 | $70,210 |
| 2019 | $7,240 | $255,200 | $54,600 | $200,600 |
| 2018 | $6,951 | $89,320 | $19,110 | $70,210 |
| 2017 | $6,736 | $78,720 | $16,280 | $62,440 |
| 2016 | $6,708 | $78,720 | $16,280 | $62,440 |
| 2015 | $6,030 | $78,720 | $16,280 | $62,440 |
| 2014 | $6,030 | $72,880 | $15,090 | $57,790 |
Source: Public Records
Map
Nearby Homes
- 26716 Midland Rd
- 27028 Normandy Rd
- 360 Kenilworth Rd
- 26600 Osborn Rd
- 349 Kenilworth Rd
- 468 Canterbury Rd
- 26741 Osborn Rd
- 27407 Wolf Rd
- 495 Cahoon Rd
- 514 Kenilworth Rd
- 481 Cahoon Rd
- 479 Cahoon Rd
- 477 Cahoon Rd
- 26927 E Oviatt Rd
- 518 Huntmere Dr
- 25550 Lake Rd
- 525 Oakmoor Rd
- 575 Columbia Rd
- 28205 W Oviatt Rd
- 27320 Langale Rd
- 26705 Bruce Rd
- 26713 Bruce Rd
- 26715 Bruce Rd
- 26701 Bruce Rd
- 26710 Russell Rd
- 26714 Russell Rd
- 26719 Bruce Rd
- 26704 Russell Rd
- 26627 Bruce Rd
- 26754 Russell Rd
- 26700 Russell Rd
- 26758 Russell Rd
- 26710 Bruce Rd
- 26723 Bruce Rd
- 26714 Bruce Rd
- 26704 Bruce Rd
- 26626 Russell Rd
- 26623 Bruce Rd
- 26720 Bruce Rd
- 26700 Bruce Rd