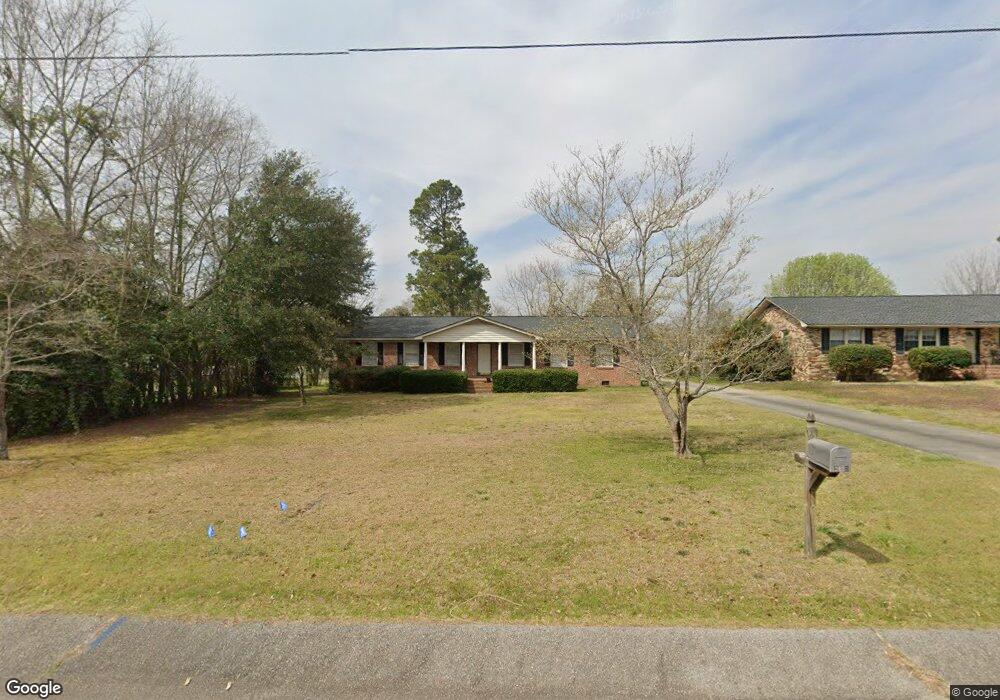
2673 Riley St Orangeburg, SC 29118
Estimated Value: $209,000 - $261,000
4
Beds
2
Baths
2,064
Sq Ft
$111/Sq Ft
Est. Value
About This Home
This home is located at 2673 Riley St, Orangeburg, SC 29118 and is currently estimated at $228,285, approximately $110 per square foot. 2673 Riley St is a home located in Orangeburg County with nearby schools including Marshall Elementary School, Marshall Elementary, and William J. Clark Middle School.
Ownership History
Date
Name
Owned For
Owner Type
Purchase Details
Closed on
Oct 12, 2012
Sold by
Estate Of Patricia Padgett Holman and Holman Kennedy Pamela
Bought by
Kennedy Pamela Holman
Current Estimated Value
Create a Home Valuation Report for This Property
The Home Valuation Report is an in-depth analysis detailing your home's value as well as a comparison with similar homes in the area
Home Values in the Area
Average Home Value in this Area
Purchase History
| Date | Buyer | Sale Price | Title Company |
|---|---|---|---|
| Kennedy Pamela Holman | -- | -- |
Source: Public Records
Tax History Compared to Growth
Tax History
| Year | Tax Paid | Tax Assessment Tax Assessment Total Assessment is a certain percentage of the fair market value that is determined by local assessors to be the total taxable value of land and additions on the property. | Land | Improvement |
|---|---|---|---|---|
| 2024 | $1,762 | $7,931 | $807 | $7,124 |
| 2023 | $1,576 | $5,399 | $767 | $4,632 |
| 2022 | $1,468 | $5,399 | $767 | $4,632 |
| 2021 | $1,457 | $5,399 | $767 | $4,632 |
| 2020 | $1,435 | $5,399 | $767 | $4,632 |
| 2019 | $1,441 | $5,399 | $767 | $4,632 |
| 2018 | $1,310 | $5,135 | $767 | $4,368 |
| 2017 | $1,258 | $5,135 | $0 | $0 |
| 2016 | $1,257 | $5,135 | $0 | $0 |
| 2015 | $733 | $5,135 | $0 | $0 |
| 2014 | $733 | $5,135 | $767 | $4,368 |
| 2013 | -- | $5,519 | $767 | $4,752 |
Source: Public Records
Map
Nearby Homes
- 00 Riley St
- 0 Riley St
- 2778 Riley St
- 2753 Hillcrest St NE
- 2753 Hillcrest Ave
- 2220 Hillside St
- 2220 Hillside St NE
- 2136 Pinnacle St
- 2415 Riley St
- 2395 Lakeside St
- 2251 Hillcrest Ave Unit 6C
- 2354 Northview Dr Unit 2A
- 2358 Northview Dr Unit 2B
- 2336 Northview Dr Unit 3-C
- 2348 Northview Dr Unit 3F
- 2320 Mall Terrace Ct Unit 2320
- 336 Young Town Cir
- 312 Young Town Cir
- 272 Young Town Cir
- 284 Young Town Cir
- 2695 Riley St
- 2649 Riley St
- 2726 Hillcrest Ave
- 2066 Skyland Ln
- 2735 Riley St
- 2712 Hillcrest Ave
- 2678 Riley St
- 2662 Riley St
- 2623 Riley St
- 2756 Hillcrest Ave
- 2696 Riley St
- 2646 Riley St
- 2718 Riley St
- 2764 Hillcrest Ave
- 2769 Riley St
- 2692 Hillcrest Ave
- 2620 Riley St
- 2715 Hillcrest Ave
- 2738 Riley St
- 2063 Skyland Ln