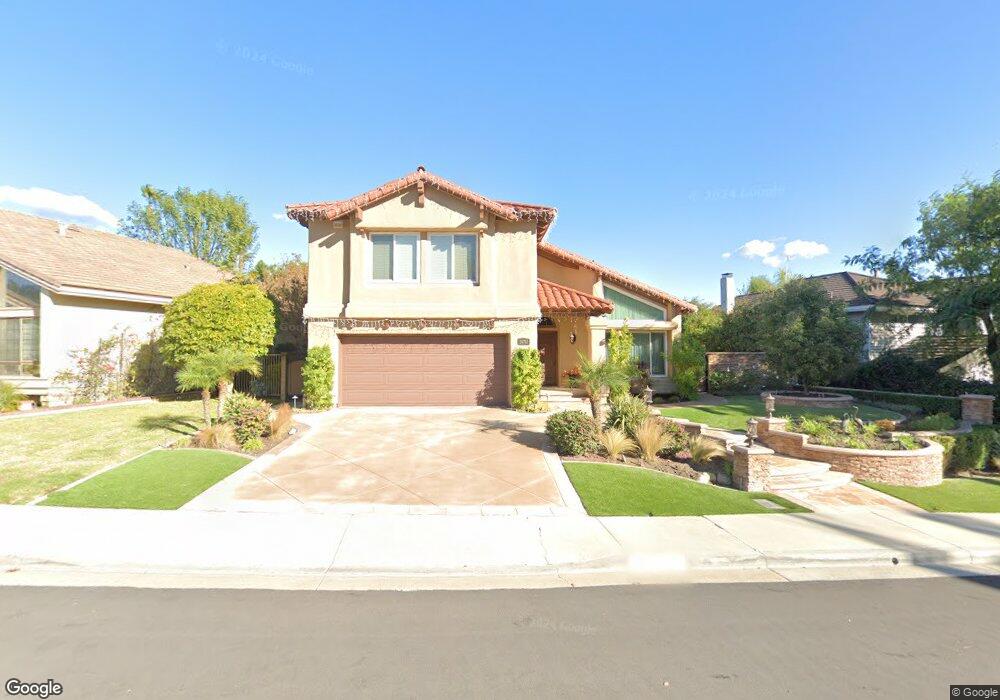
26742 Sotelo Mission Viejo, CA 92692
Estimated Value: $1,469,373 - $1,554,000
4
Beds
3
Baths
2,373
Sq Ft
$634/Sq Ft
Est. Value
About This Home
This home is located at 26742 Sotelo, Mission Viejo, CA 92692 and is currently estimated at $1,504,593, approximately $634 per square foot. 26742 Sotelo is a home located in Orange County with nearby schools including Carl Hankey Middle School, Capistrano Valley High School, and Mission Montessori.
Ownership History
Date
Name
Owned For
Owner Type
Purchase Details
Closed on
Mar 7, 2017
Sold by
Kruebbe David B and Kruebbe Carolyn D
Bought by
Kruebbe David B and Kruebbe Carolyn D
Current Estimated Value
Purchase Details
Closed on
May 20, 1994
Sold by
Sherman Matthew M and Sherman Linda B
Bought by
Kruebbe David B and Kruebbe Carolyn D
Home Financials for this Owner
Home Financials are based on the most recent Mortgage that was taken out on this home.
Original Mortgage
$241,200
Interest Rate
4.85%
Purchase Details
Closed on
Apr 1, 1994
Sold by
Sherman Matthew M and Sherman Linda B
Bought by
Sherman Matthew M and Sherman Linda B
Home Financials for this Owner
Home Financials are based on the most recent Mortgage that was taken out on this home.
Original Mortgage
$241,200
Interest Rate
4.85%
Create a Home Valuation Report for This Property
The Home Valuation Report is an in-depth analysis detailing your home's value as well as a comparison with similar homes in the area
Home Values in the Area
Average Home Value in this Area
Purchase History
| Date | Buyer | Sale Price | Title Company |
|---|---|---|---|
| Kruebbe David B | -- | None Available | |
| Kruebbe David B | $268,000 | Gateway Title Company | |
| Sherman Matthew M | -- | -- |
Source: Public Records
Mortgage History
| Date | Status | Borrower | Loan Amount |
|---|---|---|---|
| Previous Owner | Kruebbe David B | $241,200 |
Source: Public Records
Tax History Compared to Growth
Tax History
| Year | Tax Paid | Tax Assessment Tax Assessment Total Assessment is a certain percentage of the fair market value that is determined by local assessors to be the total taxable value of land and additions on the property. | Land | Improvement |
|---|---|---|---|---|
| 2025 | $4,974 | $506,619 | $165,219 | $341,400 |
| 2024 | $4,974 | $496,686 | $161,980 | $334,706 |
| 2023 | $4,867 | $486,948 | $158,804 | $328,144 |
| 2022 | $4,773 | $477,400 | $155,690 | $321,710 |
| 2021 | $4,680 | $468,040 | $152,638 | $315,402 |
| 2020 | $4,633 | $463,241 | $151,073 | $312,168 |
| 2019 | $4,540 | $454,158 | $148,110 | $306,048 |
| 2018 | $4,452 | $445,253 | $145,205 | $300,048 |
| 2017 | $4,363 | $436,523 | $142,358 | $294,165 |
| 2016 | $4,279 | $427,964 | $139,566 | $288,398 |
| 2015 | $4,230 | $421,536 | $137,470 | $284,066 |
| 2014 | $4,147 | $413,279 | $134,777 | $278,502 |
Source: Public Records
Map
Nearby Homes
- 26732 Trasmiras
- 26611 Loma Verde
- 26611 Strafford
- 26998 El Retiro
- 26848 Park Terrace Ln Unit 130
- 26766 Baronet
- 26635 Guadiana
- 26646 Guadiana
- 27075 La Fuente
- 26896 Park Terrace Ln Unit 229
- 27533 Calinda
- 26611 Dorothea
- 26466 San Torini Rd
- 26562 Lucinda
- 26553 Lucinda
- 26562 Via Mondelo
- 26972 Venado Dr
- 26192 Golada
- 26516 El Mar Dr
- 26835 Poveda Unit 29