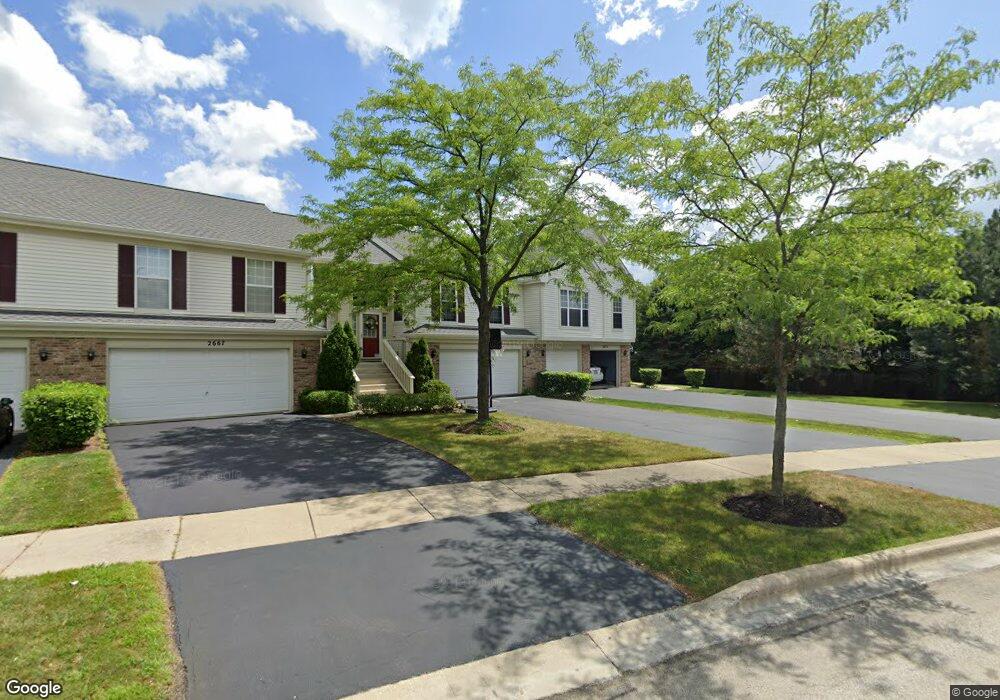
2675 S Cedar Glen Dr Unit 3026 Arlington Heights, IL 60005
Estimated Value: $348,972 - $386,000
2
Beds
3
Baths
--
Sq Ft
22.15
Acres
About This Home
This home is located at 2675 S Cedar Glen Dr Unit 3026, Arlington Heights, IL 60005 and is currently estimated at $370,993. 2675 S Cedar Glen Dr Unit 3026 is a home located in Cook County with nearby schools including Holmes Jr High School, Juliette Low Elementary School, and Rolling Meadows High School.
Ownership History
Date
Name
Owned For
Owner Type
Purchase Details
Closed on
Aug 12, 2014
Sold by
Perezic Ilijas
Bought by
Perezic Emir
Current Estimated Value
Home Financials for this Owner
Home Financials are based on the most recent Mortgage that was taken out on this home.
Original Mortgage
$169,000
Outstanding Balance
$128,486
Interest Rate
4.11%
Mortgage Type
New Conventional
Estimated Equity
$242,507
Purchase Details
Closed on
Jul 19, 2010
Sold by
Janome America Inc
Bought by
Perezic Emir and Perezic Ilijas
Home Financials for this Owner
Home Financials are based on the most recent Mortgage that was taken out on this home.
Original Mortgage
$173,825
Interest Rate
4.74%
Mortgage Type
FHA
Purchase Details
Closed on
Mar 3, 1995
Sold by
First Suburban National Bank
Bought by
Jamac Inc
Create a Home Valuation Report for This Property
The Home Valuation Report is an in-depth analysis detailing your home's value as well as a comparison with similar homes in the area
Home Values in the Area
Average Home Value in this Area
Purchase History
| Date | Buyer | Sale Price | Title Company |
|---|---|---|---|
| Perezic Emir | -- | -- | |
| Perezic Emir | -- | -- | |
| Perezic Emir | $212,500 | Fnt | |
| Jamac Inc | $187,500 | -- |
Source: Public Records
Mortgage History
| Date | Status | Borrower | Loan Amount |
|---|---|---|---|
| Open | Perezic Emir | $169,000 | |
| Closed | Perezic Emir | $169,000 | |
| Previous Owner | Perezic Emir | $173,825 |
Source: Public Records
Tax History Compared to Growth
Tax History
| Year | Tax Paid | Tax Assessment Tax Assessment Total Assessment is a certain percentage of the fair market value that is determined by local assessors to be the total taxable value of land and additions on the property. | Land | Improvement |
|---|---|---|---|---|
| 2024 | $6,615 | $28,890 | $5,184 | $23,706 |
| 2023 | $6,286 | $28,890 | $5,184 | $23,706 |
| 2022 | $6,286 | $28,890 | $5,184 | $23,706 |
| 2021 | $2,724 | $12,968 | $3,401 | $9,567 |
| 2020 | $2,708 | $12,968 | $3,401 | $9,567 |
| 2019 | $2,762 | $14,536 | $3,401 | $11,135 |
| 2018 | $4,424 | $19,254 | $2,915 | $16,339 |
| 2017 | $4,377 | $19,254 | $2,915 | $16,339 |
| 2016 | $4,322 | $19,254 | $2,915 | $16,339 |
| 2015 | $3,942 | $16,836 | $2,591 | $14,245 |
| 2014 | $3,906 | $16,836 | $2,591 | $14,245 |
| 2013 | $3,796 | $16,836 | $2,591 | $14,245 |
Source: Public Records
Map
Nearby Homes
- 1119 E Algonquin Rd Unit 2
- 1119 E Algonquin Rd Unit 7
- 1107 E Algonquin Rd Unit 4
- 1115 E Algonquin Rd Unit 8
- 1111 E Algonquin Rd Unit 1
- 2669 S Embers Ln Unit 142669
- 2831 S Embers Ln Unit 352831
- 2829 S Briarwood Dr E
- 1785 W Algonquin Rd Unit 2A
- 1727 W Crystal Ln Unit 208
- 1747 W Crystal Ln Unit 308
- 1813 W Pheasant Trail
- 1500 S Busse Rd Unit 2D
- 1900 W Knightsbridge Dr Unit 2B
- 1717 W Crystal Ln Unit 701
- 1717 W Crystal Ln Unit 610
- 1910 W Hatherleigh Ct Unit 2A
- 1915 Whitechapel Dr Unit 1E
- 2342 S Shag Bark Trail
- 1822 W Catalpa Ln
- 2671 S Cedar Glen Dr Unit 3026
- 2667 S Cedar Glen Dr Unit 3026
- 2663 S Cedar Glen Dr Unit 3026
- 2663 S Cedar Glen Dr Unit 2663
- 2659 S Cedar Glen Dr Unit 3026
- 2659 S Cedar Glen Dr Unit B
- 2720 S Briarwood Dr W
- 2726 S Briarwood Dr W
- 2655 S Cedar Glen Dr Unit 2926
- 2651 S Cedar Glen Dr Unit 2926
- 2651 S Cedar Glen Dr Unit A
- 2718 S Briarwood Dr W
- 2656 S Cedar Glen Dr Unit 25265
- 2728 S Briarwood Dr W
- 2647 S Cedar Glen Dr Unit 29264
- 2652 S Cedar Glen Dr Unit 25265
- 2652 S Cedar Glen Dr Unit A
- 1107 E Algonquin Rd Unit 15
- 1107 E Algonquin Rd Unit 11071
- 1107 E Algonquin Rd Unit 11073