Estimated Value: $277,000 - $325,476
3
Beds
1
Bath
1,388
Sq Ft
$213/Sq Ft
Est. Value
About This Home
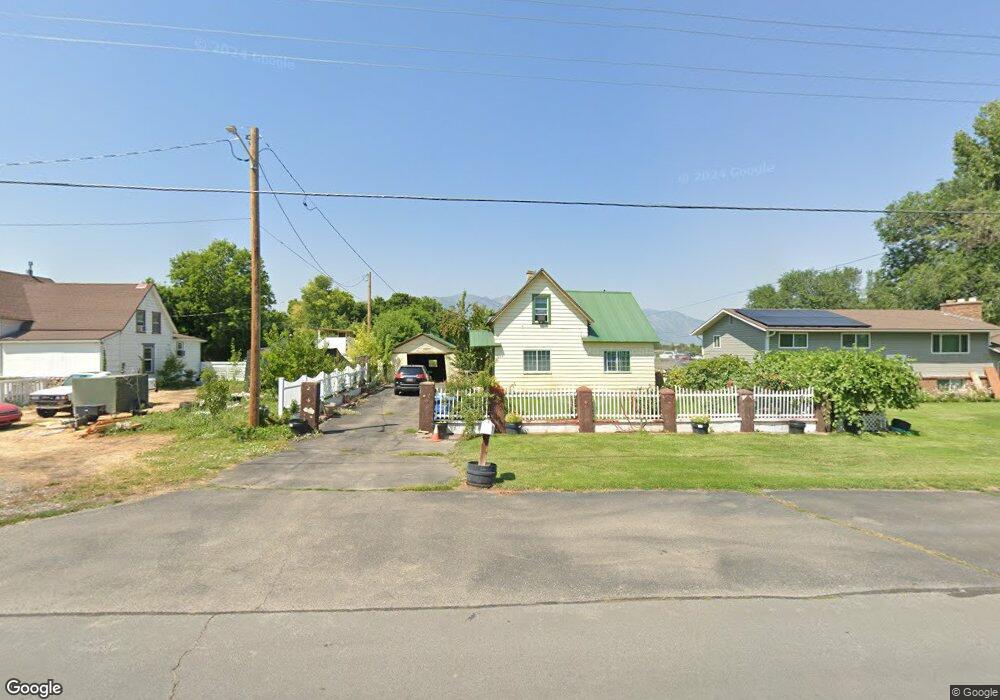
This home is located at 268 S 200 W, Hyrum, UT 84319 and is currently estimated at $295,869, approximately $213 per square foot. 268 S 200 W is a home located in Cache County with nearby schools including Lincoln School, South Cache Middle School, and Mountain Crest High School.
Ownership History
Date
Name
Owned For
Owner Type
Purchase Details
Closed on
Jan 9, 2025
Sold by
Fiefia Family Llc
Bought by
Parshall Brendon Tyler
Current Estimated Value
Home Financials for this Owner
Home Financials are based on the most recent Mortgage that was taken out on this home.
Original Mortgage
$286,020
Outstanding Balance
$284,034
Interest Rate
6.81%
Mortgage Type
VA
Estimated Equity
$11,835
Purchase Details
Closed on
Jan 25, 2024
Sold by
Fiefia Mosese K and Fiefia Ofa K
Bought by
Fiefia Family Llc
Create a Home Valuation Report for This Property
The Home Valuation Report is an in-depth analysis detailing your home's value as well as a comparison with similar homes in the area
Home Values in the Area
Average Home Value in this Area
Purchase History
| Date | Buyer | Sale Price | Title Company |
|---|---|---|---|
| Parshall Brendon Tyler | -- | Cache Title | |
| Fiefia Family Llc | -- | None Listed On Document |
Source: Public Records
Mortgage History
| Date | Status | Borrower | Loan Amount |
|---|---|---|---|
| Open | Parshall Brendon Tyler | $286,020 |
Source: Public Records
Tax History Compared to Growth
Tax History
| Year | Tax Paid | Tax Assessment Tax Assessment Total Assessment is a certain percentage of the fair market value that is determined by local assessors to be the total taxable value of land and additions on the property. | Land | Improvement |
|---|---|---|---|---|
| 2024 | $1,148 | $153,870 | $0 | $0 |
| 2023 | $1,288 | $165,080 | $0 | $0 |
| 2022 | $1,293 | $158,905 | $0 | $0 |
| 2021 | $1,186 | $224,558 | $63,670 | $160,888 |
| 2020 | $1,055 | $187,430 | $63,670 | $123,760 |
| 2019 | $969 | $161,870 | $38,110 | $123,760 |
| 2018 | $920 | $148,610 | $38,110 | $110,500 |
| 2017 | $812 | $68,040 | $0 | $0 |
| 2016 | $830 | $68,040 | $0 | $0 |
| 2015 | $832 | $68,040 | $0 | $0 |
| 2014 | $827 | $69,140 | $0 | $0 |
| 2013 | -- | $69,140 | $0 | $0 |
Source: Public Records
Map
Nearby Homes