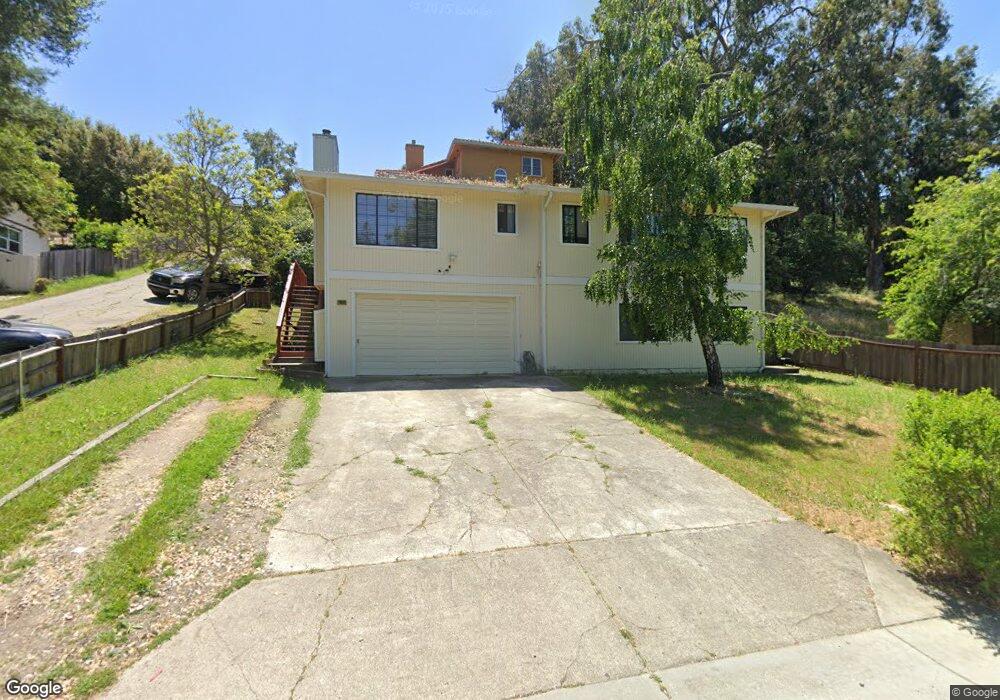
26809 New Dobbel Ave Hayward, CA 94542
Hayward Highland NeighborhoodEstimated Value: $1,212,000 - $1,352,000
4
Beds
3
Baths
2,415
Sq Ft
$534/Sq Ft
Est. Value
About This Home
This home is located at 26809 New Dobbel Ave, Hayward, CA 94542 and is currently estimated at $1,289,655, approximately $534 per square foot. 26809 New Dobbel Ave is a home located in Alameda County with nearby schools including Stonebrae Elementary School, Bret Harte Middle School, and Hayward High School.
Ownership History
Date
Name
Owned For
Owner Type
Purchase Details
Closed on
Jul 10, 2013
Sold by
Vagnarelli Daniele
Bought by
Hsu Yu Chieh Tiffany
Current Estimated Value
Home Financials for this Owner
Home Financials are based on the most recent Mortgage that was taken out on this home.
Original Mortgage
$265,000
Outstanding Balance
$192,368
Interest Rate
3.88%
Mortgage Type
New Conventional
Estimated Equity
$1,097,287
Purchase Details
Closed on
Feb 25, 2013
Sold by
Bank Of America Na
Bought by
Dgl Realty Inc
Purchase Details
Closed on
Oct 10, 2012
Sold by
Bennett Daisy J
Bought by
Bank Of America Na
Purchase Details
Closed on
Dec 21, 2006
Sold by
Hassan Amir and Bennett Daisy J
Bought by
Bennett Daisy J
Purchase Details
Closed on
Jul 21, 2006
Sold by
Hassan Amir
Bought by
Bennett Daisy J
Home Financials for this Owner
Home Financials are based on the most recent Mortgage that was taken out on this home.
Original Mortgage
$650,000
Interest Rate
7.25%
Mortgage Type
New Conventional
Purchase Details
Closed on
Aug 4, 2004
Sold by
Bennett Daisy
Bought by
Hassan Amir
Home Financials for this Owner
Home Financials are based on the most recent Mortgage that was taken out on this home.
Original Mortgage
$498,400
Interest Rate
4.37%
Mortgage Type
Purchase Money Mortgage
Purchase Details
Closed on
Dec 20, 2001
Sold by
Cullen Aaron M and Cullen Gwen M
Bought by
Cullen Aaron M and Cullen Gwen M
Home Financials for this Owner
Home Financials are based on the most recent Mortgage that was taken out on this home.
Original Mortgage
$375,000
Interest Rate
6.87%
Purchase Details
Closed on
Aug 27, 1998
Sold by
Rutledge Michael
Bought by
Cullen Aaron M and Perich Gwen M
Home Financials for this Owner
Home Financials are based on the most recent Mortgage that was taken out on this home.
Original Mortgage
$256,000
Interest Rate
6.37%
Purchase Details
Closed on
Nov 15, 1996
Sold by
Demarce Rutledge Michael and Demarce Joan
Bought by
Rutledge Michael
Home Financials for this Owner
Home Financials are based on the most recent Mortgage that was taken out on this home.
Original Mortgage
$68,000
Interest Rate
7.88%
Purchase Details
Closed on
Jun 14, 1995
Sold by
Rutledge Shirley
Bought by
Rutledge Michael
Create a Home Valuation Report for This Property
The Home Valuation Report is an in-depth analysis detailing your home's value as well as a comparison with similar homes in the area
Home Values in the Area
Average Home Value in this Area
Purchase History
| Date | Buyer | Sale Price | Title Company |
|---|---|---|---|
| Hsu Yu Chieh Tiffany | -- | Chicago Title Company | |
| Hsu Yi Fen Richard | -- | Chicago Title Company | |
| Hsu Yue | -- | Chicago Title Company | |
| Hsu Yu Chieh Tiffany | $560,000 | Chicago Title Company | |
| Dgl Realty Inc | $367,500 | None Available | |
| Bank Of America Na | $830,898 | Landsafe Title | |
| Bennett Daisy J | -- | None Available | |
| Bennett Daisy J | -- | Financial Title Company | |
| Hassan Amir | -- | Old Republic Title Company | |
| Hassan Amir | $623,000 | Old Republic Title Company | |
| Cullen Aaron M | -- | North American Title Co | |
| Cullen Aaron M | $320,000 | North American Title Co | |
| Rutledge Michael | -- | Commonwealth Land Title Co | |
| Rutledge Michael | -- | -- |
Source: Public Records
Mortgage History
| Date | Status | Borrower | Loan Amount |
|---|---|---|---|
| Open | Hsu Yu Chieh Tiffany | $265,000 | |
| Previous Owner | Bennett Daisy J | $650,000 | |
| Previous Owner | Hassan Amir | $498,400 | |
| Previous Owner | Cullen Aaron M | $375,000 | |
| Previous Owner | Cullen Aaron M | $256,000 | |
| Previous Owner | Rutledge Michael | $68,000 | |
| Closed | Hassan Amir | $100,000 |
Source: Public Records
Tax History Compared to Growth
Tax History
| Year | Tax Paid | Tax Assessment Tax Assessment Total Assessment is a certain percentage of the fair market value that is determined by local assessors to be the total taxable value of land and additions on the property. | Land | Improvement |
|---|---|---|---|---|
| 2025 | $8,930 | $679,453 | $205,936 | $480,517 |
| 2024 | $8,930 | $665,996 | $201,899 | $471,097 |
| 2023 | $8,805 | $659,802 | $197,940 | $461,862 |
| 2022 | $8,646 | $639,867 | $194,060 | $452,807 |
| 2021 | $8,580 | $627,188 | $190,256 | $443,932 |
| 2020 | $7,826 | $627,687 | $188,306 | $439,381 |
| 2019 | $7,889 | $615,383 | $184,615 | $430,768 |
| 2018 | $7,397 | $603,321 | $180,996 | $422,325 |
| 2017 | $7,224 | $591,494 | $177,448 | $414,046 |
| 2016 | $6,817 | $579,896 | $173,969 | $405,927 |
| 2015 | $6,678 | $571,188 | $171,356 | $399,832 |
| 2014 | $6,337 | $560,000 | $168,000 | $392,000 |
Source: Public Records
Map
Nearby Homes
- 2485 Saint Helena Dr Unit 3
- 2437 Saint Helena Dr Unit 3
- 0 Chronicle Ave Unit 41091503
- 2419 Saint Helena Dr Unit 6
- 25912 Hayward Blvd Unit 106
- 27030 Parkside Dr
- 2151 Brandywine Place
- 2108 Thistle Ct
- 0 Hayward Blvd Unit 41103610
- 0 Parkside Dr
- 2743 Gamble Ct
- 3274 Red Leaf Ct
- 25910 Westview Way
- 27896 Adobe Ct
- 0 Morse Ct Unit 41105392
- 25265 Morse Ct
- 27050 Vista Bahia Way
- 25091 Oakridge Ct
- 2833 Colony View Place
- 2701 Colony View Place
- 26821 New Dobbel Ave
- 26794 New Dobbel Ave
- 26825 New Dobbel Ave
- 26880 New Dobbel Ave
- 26851 New Dobbel Ave
- 27018 Grandview Ave
- 26859 New Dobbel Ave
- 26867 New Dobbel Ave
- 27022 Grandview Ave
- 26986 Grandview Ave
- 2475 Creekside Ct
- 2485 Creekside Ct Unit None
- 2485 Creekside Ct Unit 2485
- 2495 Creekside Ct Unit 2495
- 26701 New Dobbel Ave
- 2477 Creekside Ct Unit 2477
- 2493 Creekside Ct
- 26775 Hayward Blvd
- 2487 Creekside Ct
- 26910 Grandview Ave