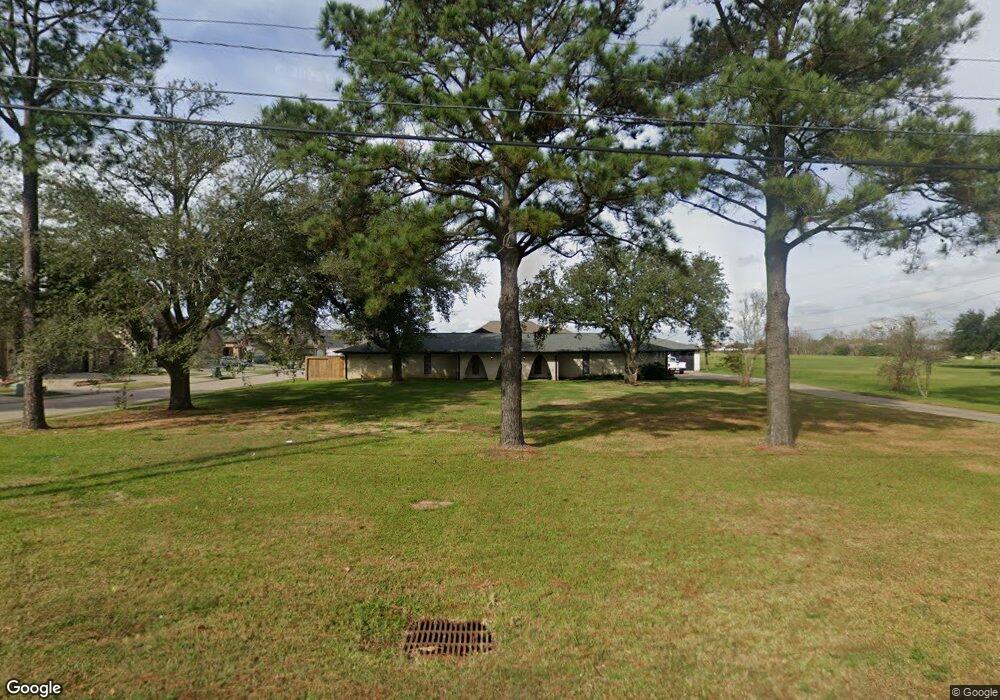
2690 90th St Port Arthur, TX 77640
Estimated Value: $318,000 - $394,000
4
Beds
2
Baths
2,059
Sq Ft
$167/Sq Ft
Est. Value
About This Home
This home is located at 2690 90th St, Port Arthur, TX 77640 and is currently estimated at $344,551, approximately $167 per square foot. 2690 90th St is a home located in Jefferson County with nearby schools including Nederland High School.
Ownership History
Date
Name
Owned For
Owner Type
Purchase Details
Closed on
Jul 23, 2012
Sold by
Hill Ramon C
Bought by
Zavala David
Current Estimated Value
Home Financials for this Owner
Home Financials are based on the most recent Mortgage that was taken out on this home.
Original Mortgage
$208,160
Outstanding Balance
$144,030
Interest Rate
3.72%
Mortgage Type
FHA
Estimated Equity
$200,521
Purchase Details
Closed on
Jan 7, 2008
Sold by
Hill Ramon C
Bought by
Greenehill Park Phase Ii Llc
Home Financials for this Owner
Home Financials are based on the most recent Mortgage that was taken out on this home.
Original Mortgage
$650,000
Interest Rate
6.07%
Mortgage Type
Seller Take Back
Purchase Details
Closed on
Jul 29, 2005
Sold by
Hill Ramon
Bought by
Bartlett L M and Bartlett Barbara K
Purchase Details
Closed on
Jun 17, 2005
Sold by
Bartlett L M and Bartlett Barbara K
Bought by
City Of Port Arthur
Create a Home Valuation Report for This Property
The Home Valuation Report is an in-depth analysis detailing your home's value as well as a comparison with similar homes in the area
Home Values in the Area
Average Home Value in this Area
Purchase History
| Date | Buyer | Sale Price | Title Company |
|---|---|---|---|
| Zavala David | -- | None Available | |
| Greenehill Park Phase Ii Llc | -- | None Available | |
| Bartlett L M | -- | -- | |
| City Of Port Arthur | -- | -- |
Source: Public Records
Mortgage History
| Date | Status | Borrower | Loan Amount |
|---|---|---|---|
| Open | Zavala David | $208,160 | |
| Previous Owner | Greenehill Park Phase Ii Llc | $650,000 |
Source: Public Records
Tax History Compared to Growth
Tax History
| Year | Tax Paid | Tax Assessment Tax Assessment Total Assessment is a certain percentage of the fair market value that is determined by local assessors to be the total taxable value of land and additions on the property. | Land | Improvement |
|---|---|---|---|---|
| 2025 | $5,651 | $323,378 | $95,088 | $228,290 |
| 2024 | $5,651 | $300,218 | -- | -- |
| 2023 | $5,651 | $272,925 | $0 | $0 |
| 2022 | $6,859 | $248,114 | $19,824 | $228,290 |
| 2021 | $7,206 | $239,960 | $19,824 | $220,136 |
| 2020 | $5,540 | $232,654 | $19,824 | $212,830 |
| 2019 | $5,716 | $200,410 | $19,820 | $180,590 |
| 2018 | $4,422 | $187,510 | $19,820 | $167,690 |
| 2017 | $4,608 | $200,290 | $19,820 | $180,470 |
| 2016 | $5,430 | $198,470 | $19,820 | $178,650 |
| 2015 | $4,873 | $205,900 | $19,820 | $186,080 |
| 2014 | $4,873 | $205,900 | $19,820 | $186,080 |
Source: Public Records
Map
Nearby Homes
- 9200 Lisa Ln
- 9101 Laura Ln
- 10125 Dominion Ranch Dr
- 3615 Avenue G
- 2600 Stable Gate Ln
- 10230 Maple Falls
- 3404 Avenue L
- 2650 Cedar Springs Ln
- 139 Hilldale Dr
- 619 S 33rd St
- 156 Hilldale Dr
- 440 Highway 365
- 2904 Avenue I
- 215 N 37th St
- 2820 Avenue N
- 2719 Avenue M
- 215 N 34th St
- 204 N 33rd St
- 307 N 32nd St
- 3301 Roya Ct
- 0000 90th St
- 9125 Lisa Ln
- 9145 Lisa Ln
- 9101 Lisa Ln
- 9220 Lisa Ln
- 9201 Lisa Lane (Lot 42)
- 9225 Lisa Lane (Lot 41)
- 9225 Lisa Ln
- 9240 Lisa Ln
- 9120 Laura Ln
- 9140 Laura Ln
- 9108 Laura Ln
- 9245 Lisa Lane (Lot 40)
- 2390 90th St
- 9200 Laura Ln
- 9306 Lisa Ln
- 9301 Lisa Lane (Lot 39)
- 2814 90th St
- 9301 Lisa Ln
- 9240 Laura Ln