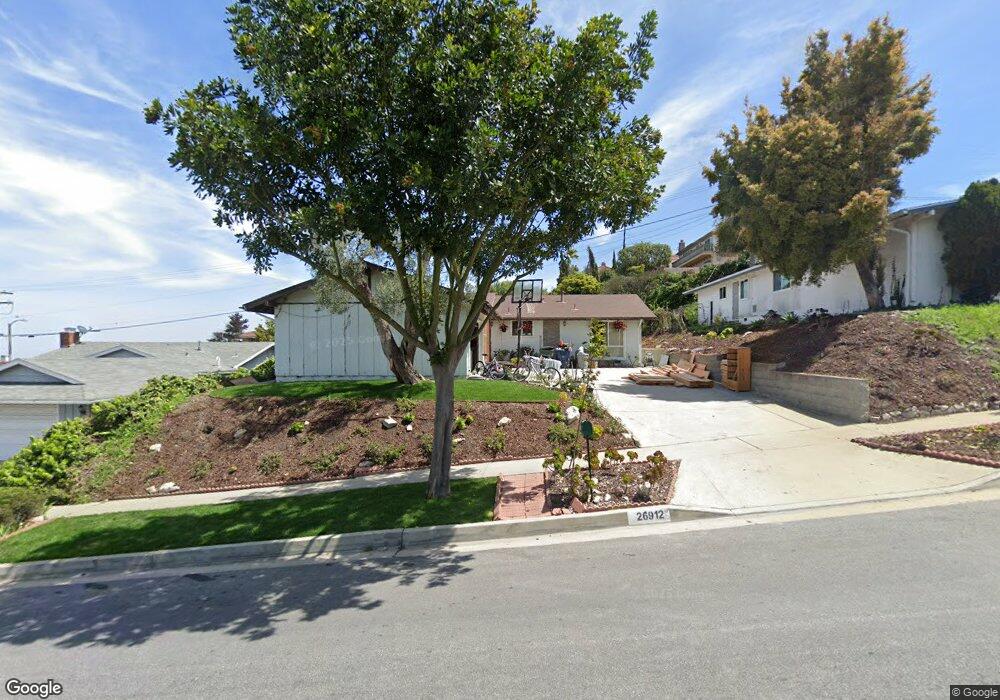
26912 Grayslake Rd Rancho Palos Verdes, CA 90275
Estimated Value: $1,615,000 - $2,024,000
3
Beds
2
Baths
1,667
Sq Ft
$1,114/Sq Ft
Est. Value
About This Home
This home is located at 26912 Grayslake Rd, Rancho Palos Verdes, CA 90275 and is currently estimated at $1,857,176, approximately $1,114 per square foot. 26912 Grayslake Rd is a home located in Los Angeles County with nearby schools including Montemalaga Elementary School, Palos Verdes Intermediate School, and Palos Verdes Peninsula High School.
Ownership History
Date
Name
Owned For
Owner Type
Purchase Details
Closed on
May 28, 2014
Sold by
Neil Maggie K O
Bought by
Neil Maggie K O and Neil Lindsay G O
Current Estimated Value
Purchase Details
Closed on
Jun 17, 2004
Sold by
Klein Robert J and Bechle Jane
Bought by
Oneil Maggie K
Home Financials for this Owner
Home Financials are based on the most recent Mortgage that was taken out on this home.
Original Mortgage
$400,000
Outstanding Balance
$199,588
Interest Rate
6.31%
Mortgage Type
Purchase Money Mortgage
Estimated Equity
$1,657,588
Purchase Details
Closed on
Aug 7, 1996
Sold by
Svoboda Roberg G
Bought by
Klein Robert J and Bechle Jane
Home Financials for this Owner
Home Financials are based on the most recent Mortgage that was taken out on this home.
Original Mortgage
$180,000
Interest Rate
7.88%
Mortgage Type
Balloon
Create a Home Valuation Report for This Property
The Home Valuation Report is an in-depth analysis detailing your home's value as well as a comparison with similar homes in the area
Home Values in the Area
Average Home Value in this Area
Purchase History
| Date | Buyer | Sale Price | Title Company |
|---|---|---|---|
| Neil Maggie K O | -- | Orange Coast Title Company | |
| Oneil Maggie K | $749,000 | Gateway Title Company | |
| Oneil Maggie K | -- | Gateway Title | |
| Klein Robert J | $52,000 | Chicago Title |
Source: Public Records
Mortgage History
| Date | Status | Borrower | Loan Amount |
|---|---|---|---|
| Open | Oneil Maggie K | $400,000 | |
| Previous Owner | Klein Robert J | $180,000 |
Source: Public Records
Tax History Compared to Growth
Tax History
| Year | Tax Paid | Tax Assessment Tax Assessment Total Assessment is a certain percentage of the fair market value that is determined by local assessors to be the total taxable value of land and additions on the property. | Land | Improvement |
|---|---|---|---|---|
| 2025 | $13,349 | $1,153,747 | $835,229 | $318,518 |
| 2024 | $13,349 | $1,131,125 | $818,852 | $312,273 |
| 2023 | $11,886 | $1,003,488 | $802,797 | $200,691 |
| 2022 | $11,291 | $983,812 | $787,056 | $196,756 |
| 2021 | $11,309 | $964,523 | $771,624 | $192,899 |
| 2019 | $10,818 | $935,917 | $748,738 | $187,179 |
| 2018 | $10,706 | $917,566 | $734,057 | $183,509 |
| 2016 | $10,177 | $881,937 | $705,553 | $176,384 |
| 2015 | $10,158 | $868,690 | $694,955 | $173,735 |
| 2014 | $10,022 | $851,674 | $681,342 | $170,332 |
Source: Public Records
Map
Nearby Homes
- 1300 Granvia Altamira
- 2457 Via Sonoma
- 27032 Freeport Rd
- 2229 Via Cerritos
- 6039 Via Sonoma
- 58 Hilltop Cir
- 1325 Via Gabriel
- 5718 Ravenspur Dr Unit 307
- 27056 Shorewood Rd
- 1133 Granvia Altamira
- 28005 Ridgebluff Ct
- 2521 Novato Place
- 5700 Ravenspur Dr Unit 107
- 15 Hilltop Cir
- 28012 Ridgeforest Ct
- 6307 Ridgeglade Ct
- 5644 Ravenspur Dr
- 28022 Ridgecove Ct N
- 5508 Ironwood St
- 28121 Highridge Rd Unit 405
- 26918 Grayslake Rd
- 26904 Grayslake Rd
- 5928 Mossbank Dr
- 26924 Grayslake Rd
- 5931 Clint Place
- 5920 Mossbank Dr
- 6002 Mossbank Dr
- 5925 Clint Place
- 26923 Grayslake Rd
- 26852 Grayslake Rd
- 5912 Mossbank Dr
- 26929 Grayslake Rd
- 26934 Grayslake Rd
- 5917 Clint Place
- 6010 Mossbank Dr
- 26844 Grayslake Rd
- 26935 Grayslake Rd
- 5911 Clint Place
- 26926 Whitestone Rd
- 5927 Mossbank Dr