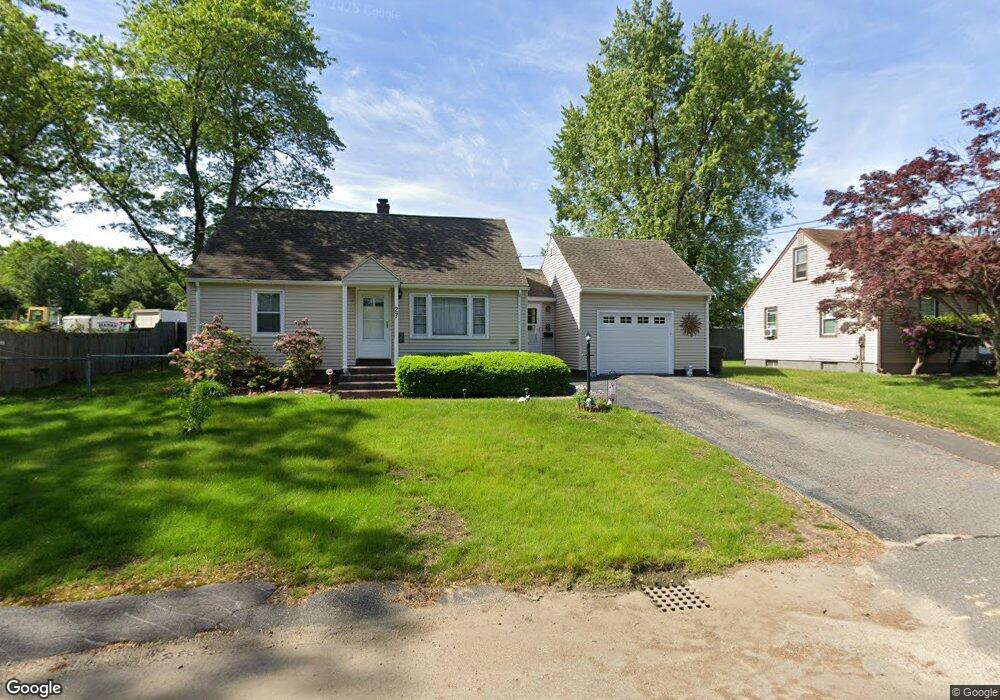
27 Babbin St Indian Orchard, MA 01151
Indian Orchard NeighborhoodEstimated Value: $273,000 - $289,883
3
Beds
1
Bath
1,005
Sq Ft
$280/Sq Ft
Est. Value
About This Home
This home is located at 27 Babbin St, Indian Orchard, MA 01151 and is currently estimated at $281,721, approximately $280 per square foot. 27 Babbin St is a home located in Hampden County with nearby schools including Hiram L. Dorman Elementary, John F. Kennedy Academy, and Springfield Central High School.
Ownership History
Date
Name
Owned For
Owner Type
Purchase Details
Closed on
Dec 20, 2011
Sold by
Rushlow Cynthia
Bought by
Cynthia A Rushlow Ret and Rushlow Cynthia A
Current Estimated Value
Purchase Details
Closed on
Mar 27, 1997
Sold by
Couture Jeanne P
Bought by
Rushlow Jeffry J and Rushlow Cynthia
Home Financials for this Owner
Home Financials are based on the most recent Mortgage that was taken out on this home.
Original Mortgage
$43,500
Interest Rate
7.59%
Mortgage Type
Purchase Money Mortgage
Create a Home Valuation Report for This Property
The Home Valuation Report is an in-depth analysis detailing your home's value as well as a comparison with similar homes in the area
Home Values in the Area
Average Home Value in this Area
Purchase History
| Date | Buyer | Sale Price | Title Company |
|---|---|---|---|
| Cynthia A Rushlow Ret | -- | -- | |
| Rushlow Jeffry J | $68,500 | -- |
Source: Public Records
Mortgage History
| Date | Status | Borrower | Loan Amount |
|---|---|---|---|
| Previous Owner | Rushlow Jeffry J | $43,500 | |
| Previous Owner | Rushlow Jeffry J | $25,000 | |
| Closed | Rushlow Jeffry J | $25,000 |
Source: Public Records
Tax History Compared to Growth
Tax History
| Year | Tax Paid | Tax Assessment Tax Assessment Total Assessment is a certain percentage of the fair market value that is determined by local assessors to be the total taxable value of land and additions on the property. | Land | Improvement |
|---|---|---|---|---|
| 2025 | $3,904 | $249,000 | $45,300 | $203,700 |
| 2024 | $3,469 | $216,000 | $42,400 | $173,600 |
| 2023 | $3,325 | $195,000 | $34,800 | $160,200 |
| 2022 | $3,132 | $166,400 | $32,500 | $133,900 |
| 2021 | $2,877 | $152,200 | $29,500 | $122,700 |
| 2020 | $2,910 | $149,000 | $29,500 | $119,500 |
| 2019 | $2,551 | $129,600 | $30,600 | $99,000 |
| 2018 | $2,612 | $132,700 | $30,600 | $102,100 |
| 2017 | $2,485 | $126,400 | $26,000 | $100,400 |
| 2016 | $2,279 | $115,900 | $26,000 | $89,900 |
| 2015 | $2,209 | $112,300 | $26,000 | $86,300 |
Source: Public Records
Map
Nearby Homes
- 42 Geneva St
- 108 Barre St
- 37 Champlain Ave
- 49 Mohegan Ave
- 34 Wallace St
- 39 Wallace St
- 19 Emily St
- 523 Boston Rd
- 65 Fargo St
- 140 Cardinal St
- 70 Shumway St Unit 29
- 70 Shumway St Unit A1
- 98 Pine Grove St
- 195 Almira Rd
- 97-99 Pine Grove St
- 89 Pine Grove St
- 54 Bernard St
- 99 Massreco St
- 200 Slater Ave
- 34 Temby St