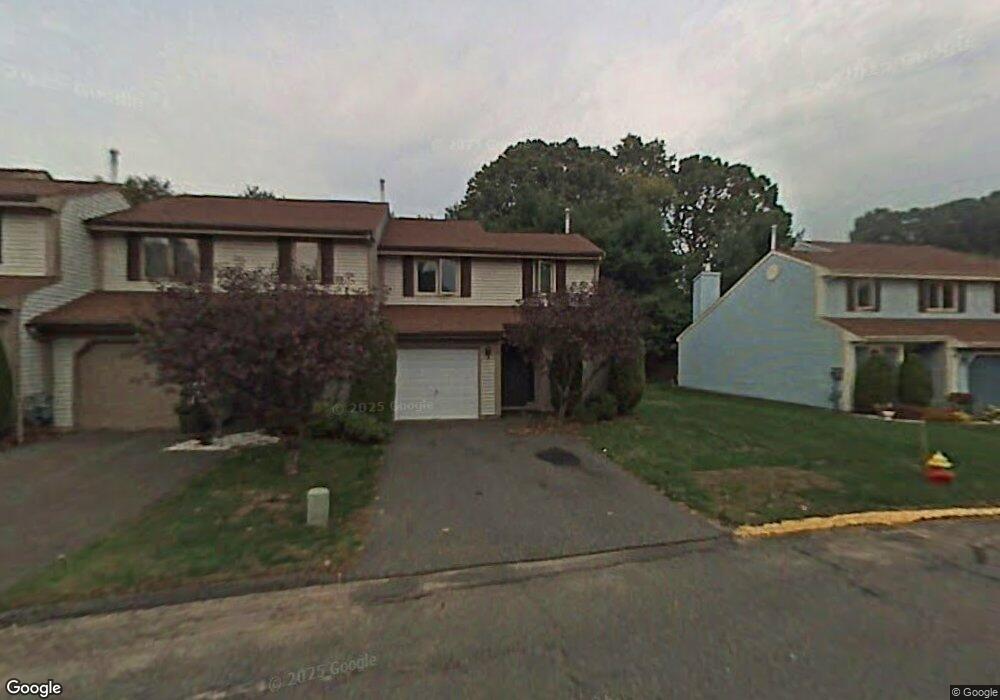
27 Copper Beech Dr Rocky Hill, CT 06067
Estimated Value: $285,949 - $332,000
2
Beds
2
Baths
1,202
Sq Ft
$254/Sq Ft
Est. Value
About This Home
This home is located at 27 Copper Beech Dr, Rocky Hill, CT 06067 and is currently estimated at $305,487, approximately $254 per square foot. 27 Copper Beech Dr is a home located in Hartford County with nearby schools including Albert D. Griswold Middle School and Rocky Hill High School.
Ownership History
Date
Name
Owned For
Owner Type
Purchase Details
Closed on
Mar 1, 2012
Sold by
Dinunzio Wendy
Bought by
Chupas Diane L
Current Estimated Value
Home Financials for this Owner
Home Financials are based on the most recent Mortgage that was taken out on this home.
Original Mortgage
$150,150
Outstanding Balance
$103,192
Interest Rate
3.88%
Estimated Equity
$202,295
Purchase Details
Closed on
Aug 2, 2010
Sold by
Buttaro Michele F
Bought by
Catania Wendy D
Home Financials for this Owner
Home Financials are based on the most recent Mortgage that was taken out on this home.
Original Mortgage
$130,000
Interest Rate
4.78%
Purchase Details
Closed on
Aug 21, 1998
Sold by
Mahen Thomas D
Bought by
Decamp Michele F
Purchase Details
Closed on
Mar 28, 1988
Sold by
Hilliard Daniel M
Bought by
Mahon Thomas D
Create a Home Valuation Report for This Property
The Home Valuation Report is an in-depth analysis detailing your home's value as well as a comparison with similar homes in the area
Home Values in the Area
Average Home Value in this Area
Purchase History
| Date | Buyer | Sale Price | Title Company |
|---|---|---|---|
| Chupas Diane L | $214,500 | -- | |
| Chupas Diane L | $214,500 | -- | |
| Catania Wendy D | $185,000 | -- | |
| Catania Wendy D | $185,000 | -- | |
| Decamp Michele F | $105,000 | -- | |
| Decamp Michele F | $105,000 | -- | |
| Mahon Thomas D | $154,900 | -- |
Source: Public Records
Mortgage History
| Date | Status | Borrower | Loan Amount |
|---|---|---|---|
| Open | Mahon Thomas D | $150,150 | |
| Closed | Mahon Thomas D | $150,150 | |
| Previous Owner | Mahon Thomas D | $130,000 |
Source: Public Records
Tax History Compared to Growth
Tax History
| Year | Tax Paid | Tax Assessment Tax Assessment Total Assessment is a certain percentage of the fair market value that is determined by local assessors to be the total taxable value of land and additions on the property. | Land | Improvement |
|---|---|---|---|---|
| 2025 | $5,123 | $169,400 | $0 | $169,400 |
| 2024 | $4,941 | $169,400 | $0 | $169,400 |
| 2023 | $4,023 | $112,000 | $0 | $112,000 |
| 2022 | $3,866 | $112,000 | $0 | $112,000 |
| 2021 | $3,819 | $112,000 | $0 | $112,000 |
| 2020 | $3,763 | $112,000 | $0 | $112,000 |
| 2019 | $3,640 | $112,000 | $0 | $112,000 |
| 2018 | $3,695 | $114,030 | $0 | $114,030 |
| 2017 | $3,603 | $114,030 | $0 | $114,030 |
| 2016 | $3,535 | $114,030 | $0 | $114,030 |
| 2015 | $3,387 | $114,030 | $0 | $114,030 |
| 2014 | $3,387 | $114,030 | $0 | $114,030 |
Source: Public Records
Map
Nearby Homes
- 27 Little Oak Ln Unit 27
- 36 Copper Beech Dr
- 50 Little Oak Ln Unit 50
- 46 Little Oak Ln Unit 46
- 45 Sandy Dr
- 370 Hayes Rd
- 41 Maxwell Dr
- 15 Murphy Dr
- 221 Westmeadow Rd
- 268 Fox Hill Rd
- 40 Country Side Dr
- 42 Rose Ct
- 211 Fairlane Dr
- 325 Fox Hill Rd
- 326 France St
- 634 New Britain Ave
- 0 Old Post Rd
- 18 Stone Hill Dr
- 155 Old Common Rd
- 37 Two Stone Dr
- 27 Copper Beech Dr Unit 27
- 111 Little Oak Ln
- 109 Little Oak Ln
- 107 Little Oak Ln
- 105 Little Oak Ln
- 103 Little Oak Ln
- 101 Little Oak Ln
- 99 Little Oak Ln
- 97 Little Oak Ln
- 96 Little Oak Ln
- 95 Little Oak Ln
- 94 Little Oak Ln
- 93 Little Oak Ln
- 92 Little Oak Ln
- 91 Little Oak Ln
- 90 Little Oak Ln
- 89 Little Oak Ln
- 88 Little Oak Ln
- 87 Little Oak Ln
- 86 Little Oak Ln