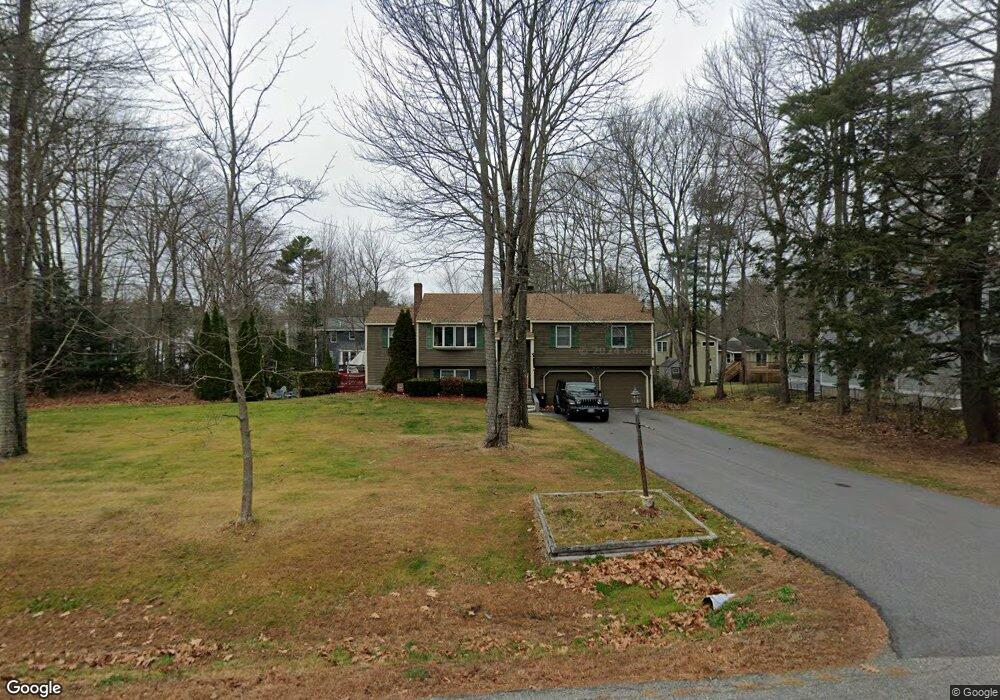
27 Date St Old Orchard Beach, ME 04064
Estimated Value: $509,052 - $605,000
3
Beds
2
Baths
1,218
Sq Ft
$451/Sq Ft
Est. Value
About This Home
This home is located at 27 Date St, Old Orchard Beach, ME 04064 and is currently estimated at $548,763, approximately $450 per square foot. 27 Date St is a home located in York County with nearby schools including Jameson Elementary School, Loranger Memorial School, and Old Orchard Beach High School.
Ownership History
Date
Name
Owned For
Owner Type
Purchase Details
Closed on
Apr 19, 2007
Sold by
Roberts Patricia A and Roberts Peter E
Bought by
Doody Alison M and Fontaine Shawn P
Current Estimated Value
Home Financials for this Owner
Home Financials are based on the most recent Mortgage that was taken out on this home.
Original Mortgage
$226,477
Outstanding Balance
$137,235
Interest Rate
6.19%
Mortgage Type
FHA
Estimated Equity
$411,528
Create a Home Valuation Report for This Property
The Home Valuation Report is an in-depth analysis detailing your home's value as well as a comparison with similar homes in the area
Home Values in the Area
Average Home Value in this Area
Purchase History
| Date | Buyer | Sale Price | Title Company |
|---|---|---|---|
| Doody Alison M | -- | -- |
Source: Public Records
Mortgage History
| Date | Status | Borrower | Loan Amount |
|---|---|---|---|
| Open | Doody Alison M | $27,473 | |
| Open | Doody Alison M | $226,477 |
Source: Public Records
Tax History Compared to Growth
Tax History
| Year | Tax Paid | Tax Assessment Tax Assessment Total Assessment is a certain percentage of the fair market value that is determined by local assessors to be the total taxable value of land and additions on the property. | Land | Improvement |
|---|---|---|---|---|
| 2024 | $4,767 | $438,100 | $172,600 | $265,500 |
| 2023 | $4,592 | $402,800 | $164,800 | $238,000 |
| 2022 | $4,461 | $364,500 | $149,800 | $214,700 |
| 2021 | $4,555 | $321,700 | $143,600 | $178,100 |
| 2020 | $3,756 | $243,600 | $81,800 | $161,800 |
| 2019 | $3,776 | $243,600 | $81,800 | $161,800 |
| 2018 | $3,652 | $238,700 | $81,800 | $156,900 |
| 2017 | $3,424 | $218,100 | $70,800 | $147,300 |
| 2016 | $3,369 | $217,900 | $67,200 | $150,700 |
| 2015 | $3,308 | $217,900 | $67,200 | $150,700 |
| 2014 | $3,242 | $217,900 | $67,200 | $150,700 |
| 2013 | $3,062 | $221,900 | $71,200 | $150,700 |
Source: Public Records
Map
Nearby Homes
- 2 Poplar St
- Lot 3-5 Juniper St
- 25 Juniper St
- 404-3-3 Juniper St
- 16 Pondview Rd
- 36 Dolphin Ave
- 58 Pheasant Rd
- 49 Pheasant Rd
- 22 A Meserve Cir
- 6 Pheasant Rd
- 2 Lindas Way
- 10 Dode Rd
- 83 Wild Dunes Way
- 77 Creeks Edge Dr
- 26 Wild Dunes Way
- 79 Creeks Edge Dr
- 4 Mickelson Way
- 20 Red Oak Dr Unit 2
- 26 Red Oak Dr Unit 5
- 81 Creeks Edge Dr