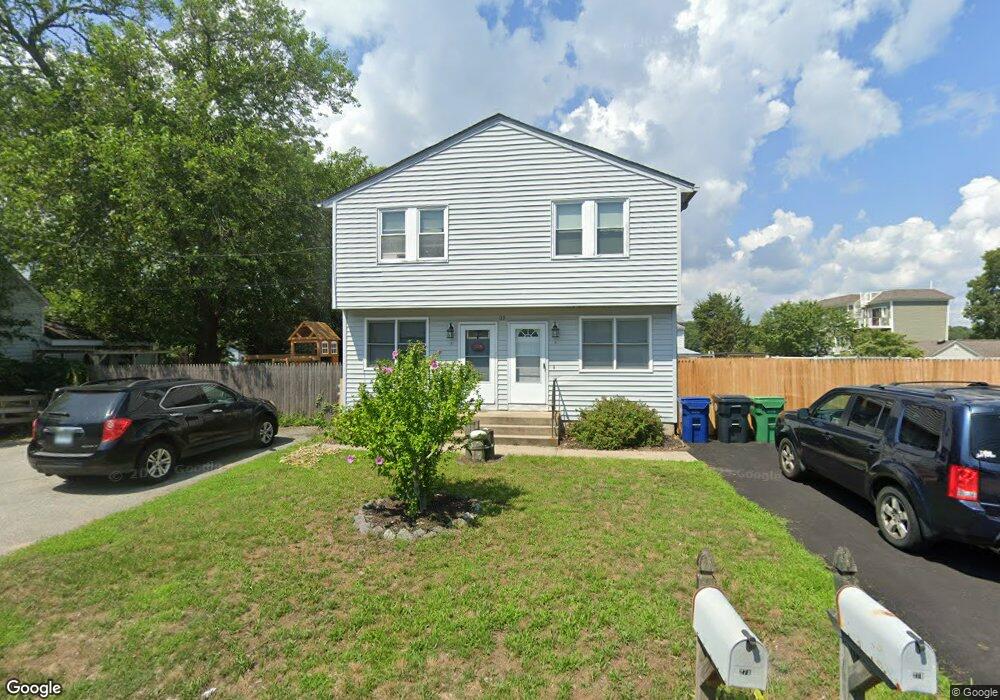
27 Forrest St Warwick, RI 02889
Oakland Beach NeighborhoodEstimated Value: $500,000 - $664,000
4
Beds
4
Baths
2,296
Sq Ft
$255/Sq Ft
Est. Value
About This Home
This home is located at 27 Forrest St, Warwick, RI 02889 and is currently estimated at $586,358, approximately $255 per square foot. 27 Forrest St is a home located in Kent County with nearby schools including Saint Kevin School and Bishop Hendricken High School.
Ownership History
Date
Name
Owned For
Owner Type
Purchase Details
Closed on
Oct 6, 2016
Sold by
Lakeview Shore
Bought by
Stewart Chad
Current Estimated Value
Home Financials for this Owner
Home Financials are based on the most recent Mortgage that was taken out on this home.
Original Mortgage
$12,800
Outstanding Balance
$10,193
Interest Rate
3.42%
Estimated Equity
$576,165
Purchase Details
Closed on
Jul 15, 2005
Sold by
Sousa Dennis M
Bought by
Gobern David A
Purchase Details
Closed on
Feb 26, 1993
Sold by
Gibbons Everett F and Gibbons Everett F
Bought by
Maini Sheri and Maini Christopher
Create a Home Valuation Report for This Property
The Home Valuation Report is an in-depth analysis detailing your home's value as well as a comparison with similar homes in the area
Home Values in the Area
Average Home Value in this Area
Purchase History
| Date | Buyer | Sale Price | Title Company |
|---|---|---|---|
| Stewart Chad | -- | -- | |
| Gobern David A | $254,000 | -- | |
| Maini Sheri | $113,000 | -- | |
| Maini Sheri | $113,000 | -- |
Source: Public Records
Mortgage History
| Date | Status | Borrower | Loan Amount |
|---|---|---|---|
| Open | Maini Sheri | $12,800 | |
| Closed | Maini Sheri | -- |
Source: Public Records
Tax History Compared to Growth
Tax History
| Year | Tax Paid | Tax Assessment Tax Assessment Total Assessment is a certain percentage of the fair market value that is determined by local assessors to be the total taxable value of land and additions on the property. | Land | Improvement |
|---|---|---|---|---|
| 2025 | $6,956 | $547,700 | $171,100 | $376,600 |
| 2024 | $6,626 | $457,900 | $141,200 | $316,700 |
| 2023 | $6,498 | $457,900 | $141,200 | $316,700 |
| 2022 | $4,875 | $260,300 | $81,000 | $179,300 |
| 2021 | $4,875 | $260,300 | $81,000 | $179,300 |
| 2020 | $4,875 | $260,300 | $81,000 | $179,300 |
| 2019 | $4,875 | $260,300 | $81,000 | $179,300 |
| 2018 | $4,761 | $228,900 | $81,000 | $147,900 |
| 2017 | $4,633 | $228,900 | $81,000 | $147,900 |
| 2016 | $4,633 | $228,900 | $81,000 | $147,900 |
| 2015 | $3,947 | $190,200 | $61,200 | $129,000 |
| 2014 | $3,815 | $190,200 | $61,200 | $129,000 |
| 2013 | $3,764 | $190,200 | $61,200 | $129,000 |
Source: Public Records
Map
Nearby Homes