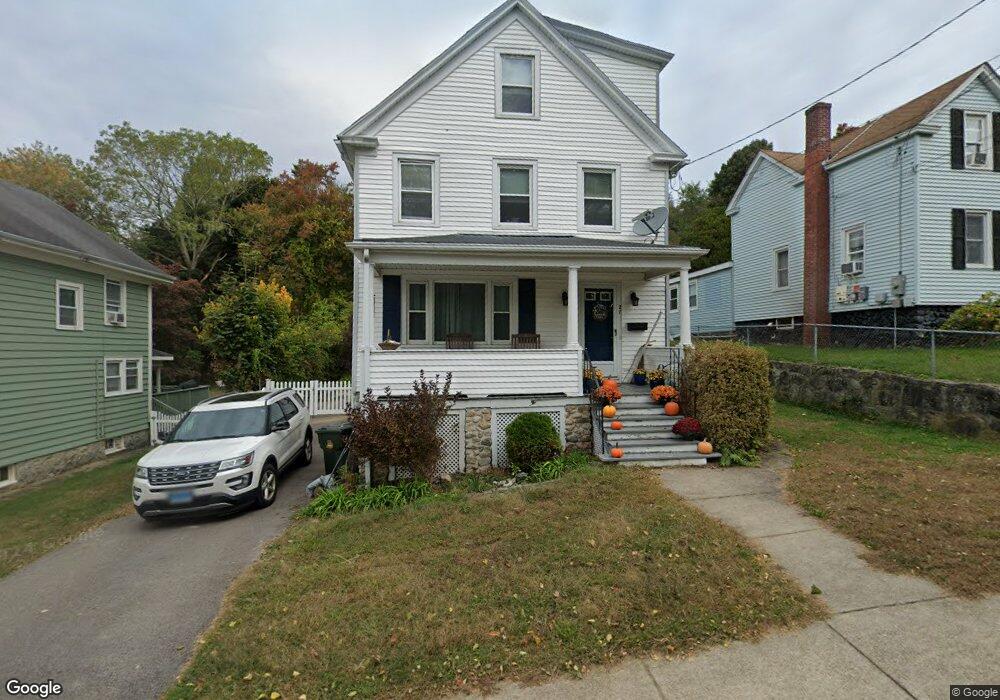
27 Fowler Ct New London, CT 06320
Willetts NeighborhoodEstimated Value: $277,000 - $424,000
3
Beds
2
Baths
2,049
Sq Ft
$177/Sq Ft
Est. Value
About This Home
This home is located at 27 Fowler Ct, New London, CT 06320 and is currently estimated at $362,130, approximately $176 per square foot. 27 Fowler Ct is a home located in New London County with nearby schools including Harbor Elementary School, Bennie Dover Jackson Middle School, and New London High School.
Ownership History
Date
Name
Owned For
Owner Type
Purchase Details
Closed on
Jun 19, 2012
Sold by
Samul Tara D
Bought by
Samul Ronald J
Current Estimated Value
Home Financials for this Owner
Home Financials are based on the most recent Mortgage that was taken out on this home.
Original Mortgage
$176,721
Outstanding Balance
$122,269
Interest Rate
3.87%
Mortgage Type
FHA
Estimated Equity
$239,861
Purchase Details
Closed on
Jan 8, 2004
Sold by
Ressler Sally and Ressler Cynthia
Bought by
Samul Ronald and Samul Tara
Home Financials for this Owner
Home Financials are based on the most recent Mortgage that was taken out on this home.
Original Mortgage
$176,700
Interest Rate
5.88%
Purchase Details
Closed on
Dec 27, 1993
Sold by
Barrios Theodore and Barrios Maria
Bought by
Murray Edward A and Murray Barbara E
Create a Home Valuation Report for This Property
The Home Valuation Report is an in-depth analysis detailing your home's value as well as a comparison with similar homes in the area
Home Values in the Area
Average Home Value in this Area
Purchase History
| Date | Buyer | Sale Price | Title Company |
|---|---|---|---|
| Samul Ronald J | -- | -- | |
| Samul Ronald J | -- | -- | |
| Samul Ronald | $186,900 | -- | |
| Samul Ronald | $186,900 | -- | |
| Murray Edward A | $108,000 | -- | |
| Murray Edward A | $108,000 | -- |
Source: Public Records
Mortgage History
| Date | Status | Borrower | Loan Amount |
|---|---|---|---|
| Open | Murray Edward A | $176,721 | |
| Closed | Murray Edward A | $176,721 | |
| Previous Owner | Murray Edward A | $176,700 |
Source: Public Records
Tax History Compared to Growth
Tax History
| Year | Tax Paid | Tax Assessment Tax Assessment Total Assessment is a certain percentage of the fair market value that is determined by local assessors to be the total taxable value of land and additions on the property. | Land | Improvement |
|---|---|---|---|---|
| 2025 | $5,388 | $198,100 | $74,100 | $124,000 |
| 2024 | $5,448 | $198,100 | $74,100 | $124,000 |
| 2023 | $4,210 | $113,050 | $46,130 | $66,920 |
| 2022 | $4,218 | $113,050 | $46,130 | $66,920 |
| 2021 | $4,290 | $113,050 | $46,130 | $66,920 |
| 2020 | $4,317 | $113,050 | $46,130 | $66,920 |
| 2019 | $4,511 | $113,050 | $46,130 | $66,920 |
| 2018 | $5,064 | $115,780 | $42,140 | $73,640 |
| 2017 | $5,124 | $115,780 | $42,140 | $73,640 |
| 2016 | $4,684 | $115,780 | $42,140 | $73,640 |
| 2015 | $4,572 | $115,780 | $42,140 | $73,640 |
| 2014 | $3,968 | $115,780 | $42,140 | $73,640 |
Source: Public Records
Map
Nearby Homes