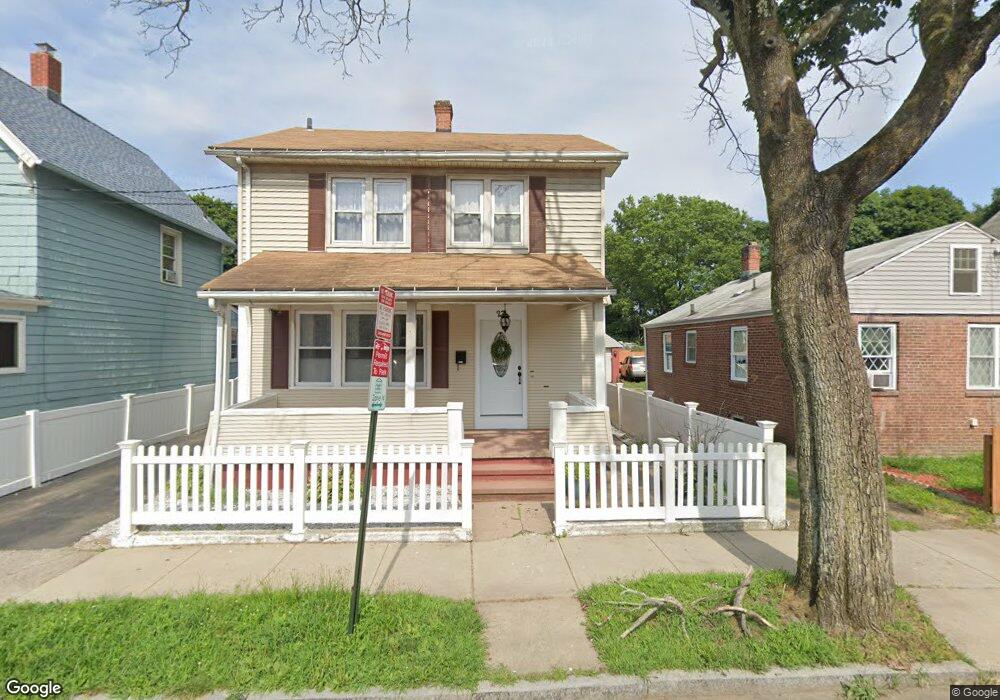
27 Morris St New Haven, CT 06519
The Hill NeighborhoodEstimated Value: $252,000 - $290,243
3
Beds
2
Baths
1,450
Sq Ft
$188/Sq Ft
Est. Value
About This Home
This home is located at 27 Morris St, New Haven, CT 06519 and is currently estimated at $272,061, approximately $187 per square foot. 27 Morris St is a home located in New Haven County with nearby schools including St Martin De Porres Academy.
Ownership History
Date
Name
Owned For
Owner Type
Purchase Details
Closed on
Aug 28, 2012
Sold by
Rolon Olga G
Bought by
Rolon Olga G and Ortiz Jose L
Current Estimated Value
Purchase Details
Closed on
Aug 13, 2009
Sold by
Morales Miguel
Bought by
Rolon Olga
Home Financials for this Owner
Home Financials are based on the most recent Mortgage that was taken out on this home.
Original Mortgage
$91,575
Interest Rate
5.36%
Purchase Details
Closed on
Nov 22, 2000
Sold by
Ct Hsng Co Llc
Bought by
Morales Miguel A
Purchase Details
Closed on
May 1, 2000
Sold by
Wall Assoc Llc
Bought by
Ct Housing Co Llc
Create a Home Valuation Report for This Property
The Home Valuation Report is an in-depth analysis detailing your home's value as well as a comparison with similar homes in the area
Home Values in the Area
Average Home Value in this Area
Purchase History
| Date | Buyer | Sale Price | Title Company |
|---|---|---|---|
| Rolon Olga G | -- | -- | |
| Rolon Olga | $110,000 | -- | |
| Morales Miguel A | $87,000 | -- | |
| Ct Housing Co Llc | $10,000 | -- |
Source: Public Records
Mortgage History
| Date | Status | Borrower | Loan Amount |
|---|---|---|---|
| Previous Owner | Ct Housing Co Llc | $91,575 | |
| Previous Owner | Ct Housing Co Llc | $82,000 | |
| Previous Owner | Ct Housing Co Llc | $7,500 |
Source: Public Records
Tax History Compared to Growth
Tax History
| Year | Tax Paid | Tax Assessment Tax Assessment Total Assessment is a certain percentage of the fair market value that is determined by local assessors to be the total taxable value of land and additions on the property. | Land | Improvement |
|---|---|---|---|---|
| 2025 | $5,000 | $126,910 | $22,750 | $104,160 |
| 2024 | $4,886 | $126,910 | $22,750 | $104,160 |
| 2023 | $4,721 | $126,910 | $22,750 | $104,160 |
| 2022 | $5,045 | $126,910 | $22,750 | $104,160 |
| 2021 | $3,707 | $84,490 | $19,670 | $64,820 |
| 2020 | $3,707 | $84,490 | $19,670 | $64,820 |
| 2019 | $3,631 | $84,490 | $19,670 | $64,820 |
| 2018 | $3,631 | $84,490 | $19,670 | $64,820 |
| 2017 | $3,268 | $84,490 | $19,670 | $64,820 |
| 2016 | $2,996 | $72,100 | $11,200 | $60,900 |
| 2015 | $2,996 | $72,100 | $11,200 | $60,900 |
| 2014 | $2,996 | $72,100 | $11,200 | $60,900 |
Source: Public Records
Map
Nearby Homes