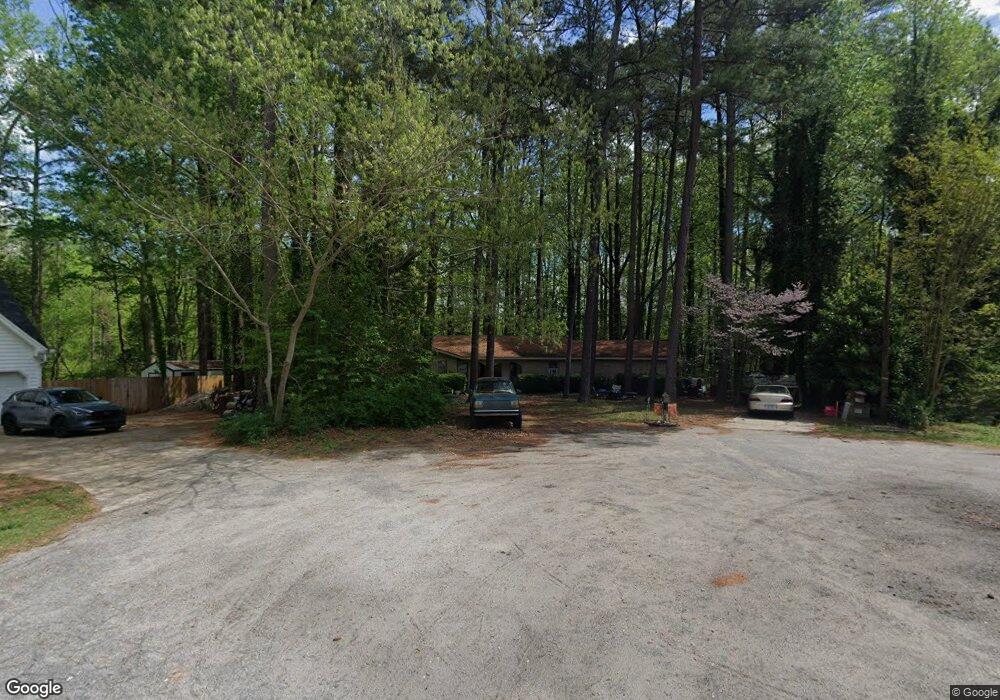
2700 Panther Dr Raleigh, NC 27603
Estimated Value: $368,000 - $472,000
--
Bed
2
Baths
2,055
Sq Ft
$203/Sq Ft
Est. Value
About This Home
This home is located at 2700 Panther Dr, Raleigh, NC 27603 and is currently estimated at $417,916, approximately $203 per square foot. 2700 Panther Dr is a home located in Wake County with nearby schools including Banks Road Elementary School.
Ownership History
Date
Name
Owned For
Owner Type
Purchase Details
Closed on
May 28, 2002
Sold by
Alumni Rho Chapter Of Sigma Pi Inc
Bought by
Fairmont United Methodist Church
Current Estimated Value
Home Financials for this Owner
Home Financials are based on the most recent Mortgage that was taken out on this home.
Original Mortgage
$140,250
Interest Rate
10.14%
Purchase Details
Closed on
May 3, 2002
Sold by
Sunset Key Investment Inc
Bought by
Coumbes Russell and Coumbes Joann
Home Financials for this Owner
Home Financials are based on the most recent Mortgage that was taken out on this home.
Original Mortgage
$140,250
Interest Rate
10.14%
Purchase Details
Closed on
May 26, 1999
Sold by
Kelly Kevin D and Kelly Charlotte H
Bought by
Sunset Key Investments Inc
Home Financials for this Owner
Home Financials are based on the most recent Mortgage that was taken out on this home.
Original Mortgage
$110,000
Interest Rate
6.9%
Create a Home Valuation Report for This Property
The Home Valuation Report is an in-depth analysis detailing your home's value as well as a comparison with similar homes in the area
Home Values in the Area
Average Home Value in this Area
Purchase History
| Date | Buyer | Sale Price | Title Company |
|---|---|---|---|
| Fairmont United Methodist Church | $150,000 | -- | |
| Coumbes Russell | $165,000 | -- | |
| Sunset Key Investments Inc | $130,000 | -- |
Source: Public Records
Mortgage History
| Date | Status | Borrower | Loan Amount |
|---|---|---|---|
| Previous Owner | Coumbes Russell | $140,250 | |
| Previous Owner | Sunset Key Investments Inc | $110,000 | |
| Closed | Sunset Key Investments Inc | $14,000 | |
| Closed | Coumbes Russell | $10,400 |
Source: Public Records
Tax History Compared to Growth
Tax History
| Year | Tax Paid | Tax Assessment Tax Assessment Total Assessment is a certain percentage of the fair market value that is determined by local assessors to be the total taxable value of land and additions on the property. | Land | Improvement |
|---|---|---|---|---|
| 2025 | $2,430 | $376,865 | $104,000 | $272,865 |
| 2024 | $2,360 | $376,865 | $104,000 | $272,865 |
| 2023 | $2,229 | $283,251 | $54,600 | $228,651 |
| 2022 | $2,066 | $283,251 | $54,600 | $228,651 |
| 2021 | $2,010 | $283,251 | $54,600 | $228,651 |
| 2020 | $1,977 | $283,251 | $54,600 | $228,651 |
| 2019 | $1,723 | $208,575 | $49,400 | $159,175 |
| 2018 | $1,585 | $208,575 | $49,400 | $159,175 |
| 2017 | $1,503 | $208,575 | $49,400 | $159,175 |
| 2016 | $1,473 | $208,575 | $49,400 | $159,175 |
| 2015 | $1,477 | $209,736 | $49,400 | $160,336 |
| 2014 | $1,400 | $209,736 | $49,400 | $160,336 |
Source: Public Records
Map
Nearby Homes
- 10329 Fanny Brown Rd
- 5216 Relay Way
- 2704 Stageline Dr
- 3205 Banks Rd
- 2600 Banks Rd Unit Lot 2
- 2600 Banks Rd Unit Lot 1
- 4824 Bristol Meadow Dr
- 5060 Trotter Dr
- 5057 Trotter Dr
- 1329 Wynncrest Ct
- 5040 Trotter Dr
- 9008 Chelsea Dr
- 4008 Bankshire Ln
- 1117 Leach St
- The Crawford Plan at Laneridge Estates
- The Crawford C Plan at Laneridge Estates
- The Beech Plan at Laneridge Estates
- 5512 Glenhurst North Dr
- 4705 Trotter Dr
- 4620 Cresta Dr
- 2704 Panther Dr
- 2701 Panther Dr
- 2708 Panther Dr
- 2705 Panther Dr
- 2700 Rustic Brick Rd
- 2701 Rustic Brick Rd
- 2708 Rustic Brick Rd
- 2709 Panther Dr
- 2705 Rustic Brick Rd
- 2712 Panther Dr
- 2716 Rustic Brick Rd
- 2709 Rustic Brick Rd
- 2713 Panther Dr
- 10221B Fanny Brown Rd
- 10221A Fanny Brown Rd
- 2717 Panther Dr
- 2824 Super Sport Ln
- 2716 Panther Dr
- 2832 Super Sport Ln
- 2720 Rustic Brick Rd