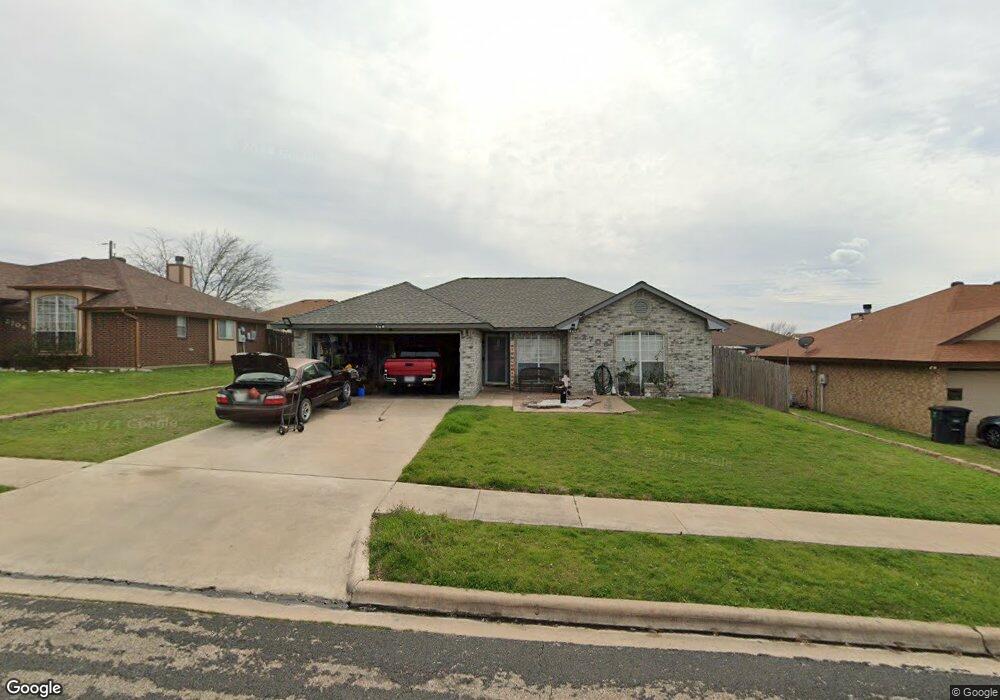
2706 Bluebonnet Dr Killeen, TX 76549
Estimated Value: $176,000 - $185,033
3
Beds
2
Baths
1,156
Sq Ft
$158/Sq Ft
Est. Value
About This Home
This home is located at 2706 Bluebonnet Dr, Killeen, TX 76549 and is currently estimated at $182,258, approximately $157 per square foot. 2706 Bluebonnet Dr is a home located in Bell County with nearby schools including Maxdale Elementary School, Live Oak Ridge Middle School, and Robert M. Shoemaker High School.
Ownership History
Date
Name
Owned For
Owner Type
Purchase Details
Closed on
Apr 2, 2010
Sold by
Secretary Of Housing & Urban Development
Bought by
Baez Victor E and Agosto Rosita
Current Estimated Value
Home Financials for this Owner
Home Financials are based on the most recent Mortgage that was taken out on this home.
Original Mortgage
$62,820
Outstanding Balance
$42,355
Interest Rate
5.25%
Mortgage Type
FHA
Estimated Equity
$139,903
Purchase Details
Closed on
Oct 16, 2009
Sold by
Wells Fargo Bank Na
Bought by
The Secretary Of Housing & Urban Develop
Purchase Details
Closed on
Oct 6, 2009
Sold by
Gordon Gisela
Bought by
Wells Fargo Bank Na
Purchase Details
Closed on
Mar 10, 2009
Sold by
Gordon Eric William
Bought by
Gordon Tanya Michealla
Purchase Details
Closed on
Oct 29, 2008
Sold by
Gordon Eric W
Bought by
Gordon Tanya M
Purchase Details
Closed on
Aug 21, 2008
Sold by
Gordon Tanya Michealla
Bought by
Gordon Eric William
Create a Home Valuation Report for This Property
The Home Valuation Report is an in-depth analysis detailing your home's value as well as a comparison with similar homes in the area
Home Values in the Area
Average Home Value in this Area
Purchase History
| Date | Buyer | Sale Price | Title Company |
|---|---|---|---|
| Baez Victor E | -- | None Available | |
| The Secretary Of Housing & Urban Develop | -- | None Available | |
| Wells Fargo Bank Na | $84,546 | None Available | |
| Gordon Tanya Michealla | -- | None Available | |
| Gordon Tanya M | -- | None Available | |
| Gordon Eric William | -- | None Available |
Source: Public Records
Mortgage History
| Date | Status | Borrower | Loan Amount |
|---|---|---|---|
| Open | Baez Victor E | $62,820 |
Source: Public Records
Tax History Compared to Growth
Tax History
| Year | Tax Paid | Tax Assessment Tax Assessment Total Assessment is a certain percentage of the fair market value that is determined by local assessors to be the total taxable value of land and additions on the property. | Land | Improvement |
|---|---|---|---|---|
| 2025 | $1,402 | $161,369 | -- | -- |
| 2024 | $1,402 | $146,699 | -- | -- |
| 2023 | $2,525 | $133,363 | $0 | $0 |
| 2022 | $2,551 | $121,239 | $0 | $0 |
| 2021 | $2,648 | $118,852 | $21,000 | $97,852 |
| 2020 | $2,527 | $102,221 | $21,000 | $81,221 |
| 2019 | $2,373 | $90,120 | $10,200 | $79,920 |
| 2018 | $2,217 | $90,309 | $10,200 | $80,109 |
| 2017 | $2,191 | $88,778 | $10,200 | $78,578 |
| 2016 | $2,160 | $87,551 | $10,200 | $77,351 |
| 2015 | $1,942 | $81,907 | $10,200 | $71,707 |
| 2014 | $1,942 | $85,478 | $0 | $0 |
Source: Public Records
Map
Nearby Homes
- 2806 Woodlands Dr
- 2806 Hemlock Dr
- 2711 Hemlock Dr
- 2505 Cactus Dr
- 2302 Huckleberry Dr
- 2403 Bluebonnet Dr
- 2405 Huckleberry Dr
- 2703 Larkspur Dr
- 2701 Wildflower Dr
- 2709 Roadrunner Dr
- TBD Cody Poe and Edgefield Dr
- 2104 Prestige Loop
- 2203 Cactus Dr
- 2501 Westwood Dr
- 1301 Westway Dr
- 1304 Royal Crest Dr
- 2229 Wheeler Ave
- 2703 Schulze Dr
- 1231 Royal Crest Dr
- 2210 Cascade Dr
- 2708 Bluebonnet Dr
- 2704 Bluebonnet Dr
- 2705 Cactus Dr
- 2710 Bluebonnet Dr
- 2703 Cactus Dr
- 2702 Bluebonnet Dr
- 2705 Bluebonnet Dr
- 2703 Bluebonnet Dr
- 2707 Bluebonnet Dr
- 2701 Cactus Dr
- 2709 Cactus Dr
- 2802 Bluebonnet Dr
- 2701 Bluebonnet Dr
- 2709 Bluebonnet Dr
- 2708 Cactus Dr
- 376-392 Roadrunner Dr
- 2711 Bluebonnet Dr
- 2706 Woodlands Dr
- 2704 Woodlands Dr
- 2711 Cactus Dr