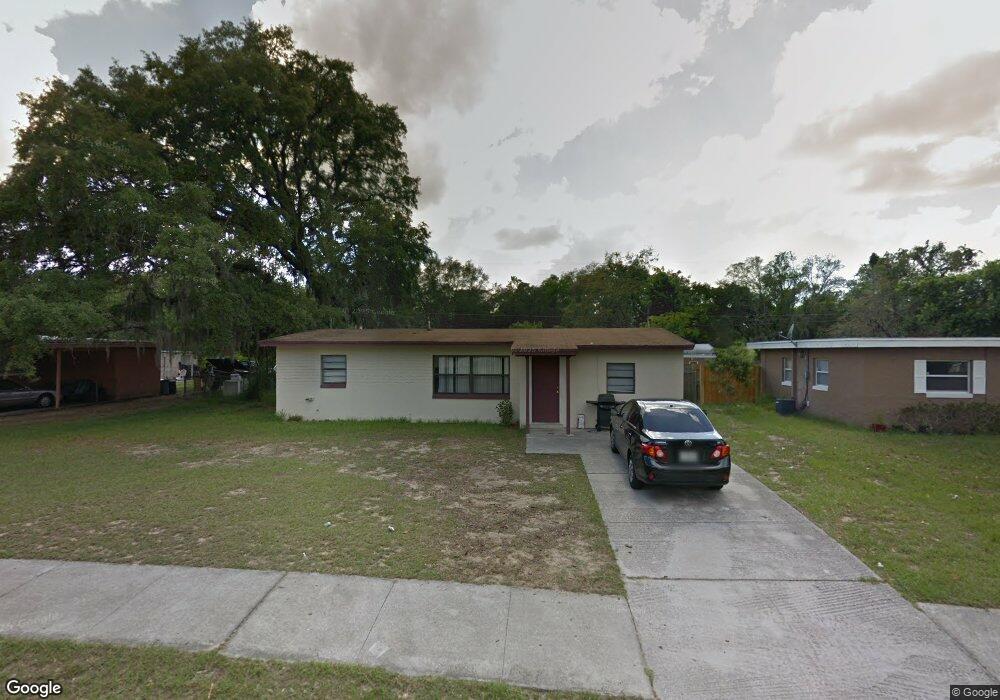
2710 Bon Air Dr Orlando, FL 32818
Estimated Value: $260,251 - $279,000
3
Beds
1
Bath
1,308
Sq Ft
$204/Sq Ft
Est. Value
About This Home
This home is located at 2710 Bon Air Dr, Orlando, FL 32818 and is currently estimated at $267,063, approximately $204 per square foot. 2710 Bon Air Dr is a home located in Orange County with nearby schools including Pinewood Elementary School, Robinswood Middle School, and Evans High School.
Ownership History
Date
Name
Owned For
Owner Type
Purchase Details
Closed on
May 18, 2021
Sold by
Baf 3 Llc
Bought by
Baf Assets 3 Llc
Current Estimated Value
Home Financials for this Owner
Home Financials are based on the most recent Mortgage that was taken out on this home.
Original Mortgage
$366,511,000
Outstanding Balance
$149,060,978
Interest Rate
3.1%
Mortgage Type
New Conventional
Estimated Equity
-$148,793,915
Purchase Details
Closed on
Nov 16, 2020
Sold by
Gajraj Sandra and Theodore-Gajraj Sandra
Bought by
Baf 3 Llc
Purchase Details
Closed on
Jul 8, 2016
Sold by
Gajraj Arnold Amarnauth and Gajraj Sandra
Bought by
Gajraj Sandra
Purchase Details
Closed on
Jul 1, 2016
Bought by
Gajraj Sandra
Purchase Details
Closed on
Oct 10, 2001
Sold by
Bowani Gopal I
Bought by
Gajraj Arnold A and Gajraj Sandra
Home Financials for this Owner
Home Financials are based on the most recent Mortgage that was taken out on this home.
Original Mortgage
$49,000
Interest Rate
6.87%
Mortgage Type
New Conventional
Create a Home Valuation Report for This Property
The Home Valuation Report is an in-depth analysis detailing your home's value as well as a comparison with similar homes in the area
Home Values in the Area
Average Home Value in this Area
Purchase History
| Date | Buyer | Sale Price | Title Company |
|---|---|---|---|
| Baf Assets 3 Llc | $100 | None Listed On Document | |
| Baf 3 Llc | $165,000 | Turner Jarrod | |
| Gajraj Sandra | -- | None Available | |
| Gajraj Sandra | $100 | -- | |
| Gajraj Arnold A | $70,000 | -- |
Source: Public Records
Mortgage History
| Date | Status | Borrower | Loan Amount |
|---|---|---|---|
| Open | Baf Assets 3 Llc | $366,511,000 | |
| Previous Owner | Gajraj Arnold A | $49,000 |
Source: Public Records
Tax History Compared to Growth
Tax History
| Year | Tax Paid | Tax Assessment Tax Assessment Total Assessment is a certain percentage of the fair market value that is determined by local assessors to be the total taxable value of land and additions on the property. | Land | Improvement |
|---|---|---|---|---|
| 2025 | $3,048 | $180,610 | $50,000 | $130,610 |
| 2024 | $2,711 | $174,380 | $50,000 | $124,380 |
| 2023 | $2,711 | $161,019 | $45,000 | $116,019 |
| 2022 | $2,399 | $135,372 | $45,000 | $90,372 |
| 2021 | $2,264 | $124,959 | $45,000 | $79,959 |
| 2020 | $1,623 | $116,330 | $35,000 | $81,330 |
| 2019 | $1,347 | $73,686 | $31,900 | $41,786 |
| 2018 | $1,225 | $62,684 | $22,500 | $40,184 |
| 2017 | $1,086 | $50,523 | $20,000 | $30,523 |
| 2016 | $973 | $44,041 | $13,000 | $31,041 |
| 2015 | $1,020 | $50,505 | $13,000 | $37,505 |
| 2014 | $924 | $37,545 | $10,000 | $27,545 |
Source: Public Records
Map
Nearby Homes
- 7628 Eldorado Place
- 7821 Shellbark Dr
- 2921 Bon Air Dr
- 2802 Danforth Dr
- 7625 Jarvis Ct
- 2363 Bridgewood Trail
- 7456 Bordwine Dr
- 2285 Bridgewood Trail
- 2945 Southgate Terrace
- 2808 Ridge Cove Ct
- 3312 Chariot Place
- 3403 Canute Place
- 2932 Silver Ridge Dr
- 7047 Hickory Branch Cir
- 8356 Silver Star Rd
- 2950 Silver Ridge Dr
- 3426 Leemoore Place
- 3038 Golden Rock Dr
- 7118 Linmar Cir Unit 35
- 3044 Danforth Dr