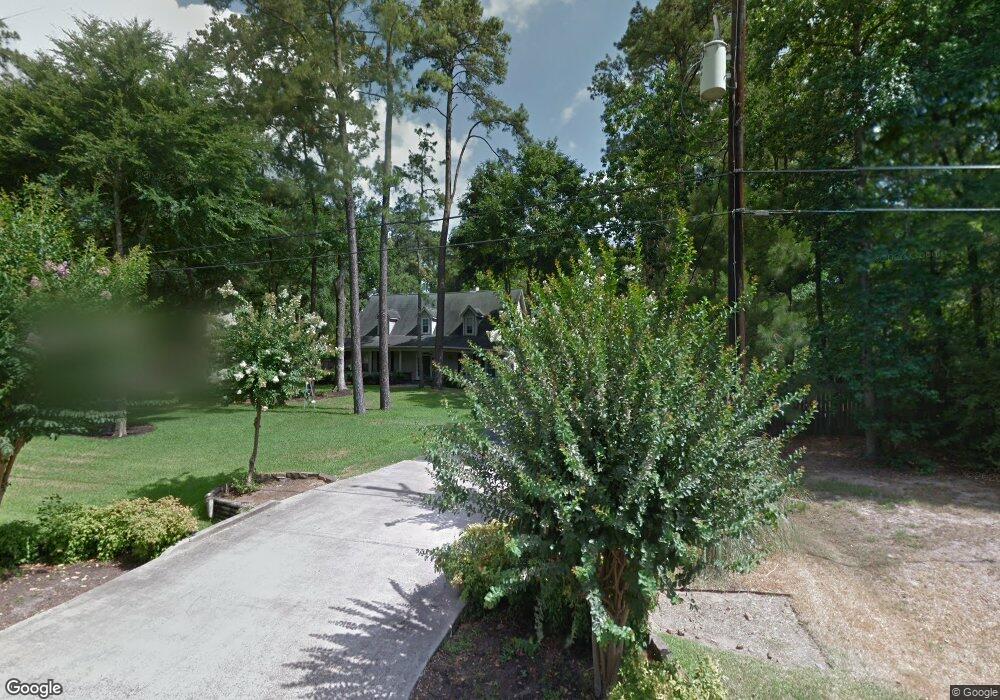
27127 Rockchapel Magnolia, TX 77355
Estimated Value: $502,000 - $581,000
4
Beds
4
Baths
2,812
Sq Ft
$193/Sq Ft
Est. Value
About This Home
This home is located at 27127 Rockchapel, Magnolia, TX 77355 and is currently estimated at $543,403, approximately $193 per square foot. 27127 Rockchapel is a home located in Montgomery County with nearby schools including Decker Prairie Elementary School, Tomball Intermediate School, and Tomball Junior High School.
Ownership History
Date
Name
Owned For
Owner Type
Purchase Details
Closed on
May 23, 1997
Sold by
Gill Family Partnership Ltd
Bought by
Brown Earl R and Brown Geraldine
Current Estimated Value
Home Financials for this Owner
Home Financials are based on the most recent Mortgage that was taken out on this home.
Original Mortgage
$146,400
Outstanding Balance
$27,925
Interest Rate
7.25%
Estimated Equity
$515,478
Purchase Details
Closed on
Jan 31, 1997
Sold by
Potter Mark and Potter Carrie
Bought by
Smith Warren and Smith Anne
Purchase Details
Closed on
May 26, 1995
Sold by
Lexington Estates Inc
Bought by
Smith Warren and Smith Anne
Home Financials for this Owner
Home Financials are based on the most recent Mortgage that was taken out on this home.
Original Mortgage
$13,800
Interest Rate
8.18%
Mortgage Type
Seller Take Back
Create a Home Valuation Report for This Property
The Home Valuation Report is an in-depth analysis detailing your home's value as well as a comparison with similar homes in the area
Home Values in the Area
Average Home Value in this Area
Purchase History
| Date | Buyer | Sale Price | Title Company |
|---|---|---|---|
| Brown Earl R | -- | Alamo Title Company | |
| Smith Warren | -- | Statewide Title Co | |
| Smith Warren | -- | -- | |
| Potter Mark | -- | Fidelity National Title |
Source: Public Records
Mortgage History
| Date | Status | Borrower | Loan Amount |
|---|---|---|---|
| Open | Brown Earl R | $146,400 | |
| Previous Owner | Potter Mark | $13,800 |
Source: Public Records
Tax History Compared to Growth
Tax History
| Year | Tax Paid | Tax Assessment Tax Assessment Total Assessment is a certain percentage of the fair market value that is determined by local assessors to be the total taxable value of land and additions on the property. | Land | Improvement |
|---|---|---|---|---|
| 2025 | $3,194 | $436,435 | -- | -- |
| 2024 | $3,143 | $396,759 | -- | -- |
| 2023 | $3,143 | $360,690 | $50,000 | $374,770 |
| 2022 | $6,058 | $327,900 | $50,000 | $277,900 |
| 2021 | $6,406 | $333,380 | $50,000 | $306,750 |
| 2020 | $6,074 | $303,070 | $50,000 | $253,070 |
| 2019 | $6,248 | $316,450 | $50,000 | $266,450 |
| 2018 | $5,891 | $316,450 | $50,000 | $266,450 |
| 2017 | $6,161 | $296,040 | $24,000 | $272,040 |
| 2016 | $6,082 | $292,280 | $24,000 | $278,480 |
| 2015 | $4,900 | $265,710 | $24,000 | $255,000 |
| 2014 | $4,900 | $241,550 | $24,000 | $239,890 |
Source: Public Records
Map
Nearby Homes
- 819 Sentinel Oaks
- 802 Sentinel Oaks
- 31523 Johlke Rd
- 611 Sentinel Oaks
- 26303 Arrowleaf Dr
- 26299 Arrowleaf Dr
- 26302 Arrowleaf Dr
- 26295 Arrowleaf Dr
- 26298 Arrowleaf Dr
- 26291 Arrowleaf Dr
- 26294 Arrowleaf Dr
- 26287 Arrowleaf Dr
- 26290 Arrowleaf Dr
- 26283 Arrowleaf Dr
- 26286 Arrowleaf Dr
- 26279 Arrowleaf Dr
- 26282 Arrowleaf Dr
- 26275 Arrowleaf Dr
- 26278 Arrowleaf Dr
- 26271 Arrowleaf Dr
- 27119 Rockchapel
- 31203 Johlke Rd
- 31211 Johlke Rd
- 27118 Holly Lord
- 27111 Rockchapel
- 31219 Johlke Rd
- 31135 Johlke Rd
- 27126 Rockchapel
- 27118 Rockchapel
- 27103 Rockchapel
- 27102 Holly Lord
- 27102 Rockchapel
- 31202 Johlke Rd
- 31210 Johlke Rd
- 27111 Holly Lord
- 31218 Johlke Rd
- 27119 Holly Lord
- 27127 Holly Lord
- XXXXX Johlke Rd
- 27014 Holly Lord