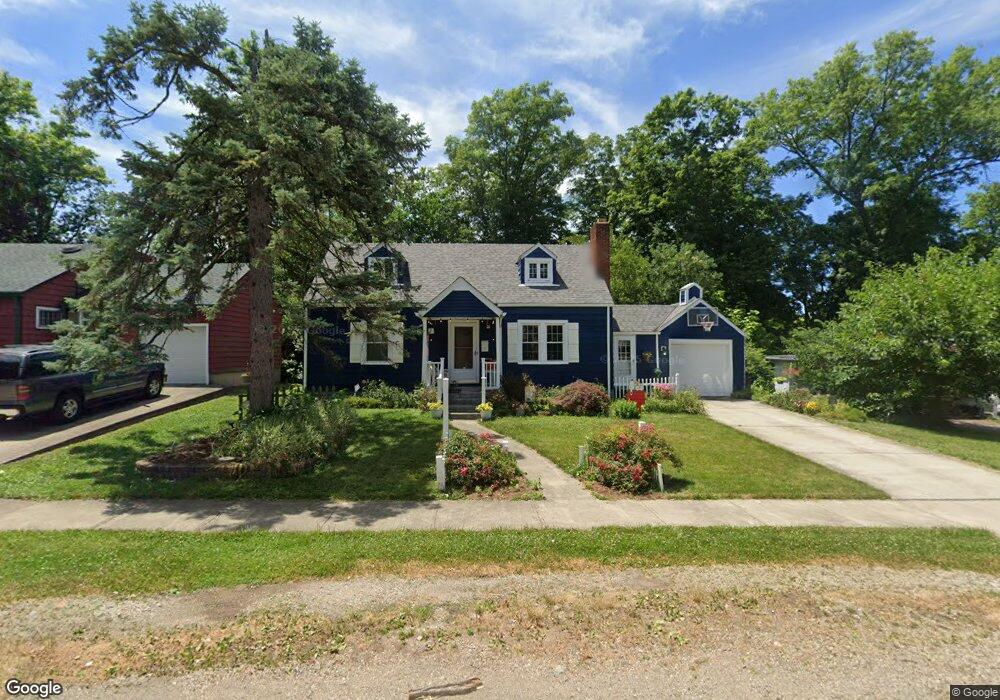
2713 Oak Park Ave Dayton, OH 45419
Estimated Value: $246,214 - $297,000
3
Beds
2
Baths
1,652
Sq Ft
$163/Sq Ft
Est. Value
About This Home
This home is located at 2713 Oak Park Ave, Dayton, OH 45419 and is currently estimated at $269,405, approximately $163 per square foot. 2713 Oak Park Ave is a home located in Montgomery County with nearby schools including Orchard Park Elementary School, Van Buren Middle School, and Kettering Fairmont High School.
Ownership History
Date
Name
Owned For
Owner Type
Purchase Details
Closed on
Sep 24, 2010
Sold by
Turner Amy K and Fisher John
Bought by
Fisher Amy K and Fisher John
Current Estimated Value
Home Financials for this Owner
Home Financials are based on the most recent Mortgage that was taken out on this home.
Original Mortgage
$134,498
Outstanding Balance
$1,025
Interest Rate
4.5%
Mortgage Type
FHA
Estimated Equity
$268,380
Purchase Details
Closed on
Nov 21, 2003
Sold by
Forrester Robert G and Forrester Paula R
Bought by
Ramirez Pedro S and Ramirez Terry L
Purchase Details
Closed on
Nov 30, 1998
Sold by
Reger Amy S and Reger Amy S
Bought by
Turner Amy K
Home Financials for this Owner
Home Financials are based on the most recent Mortgage that was taken out on this home.
Original Mortgage
$101,400
Interest Rate
6.62%
Purchase Details
Closed on
Mar 29, 1996
Sold by
Fogarty Canice J and Fogarty Michelle A
Bought by
Reger Amy S
Create a Home Valuation Report for This Property
The Home Valuation Report is an in-depth analysis detailing your home's value as well as a comparison with similar homes in the area
Home Values in the Area
Average Home Value in this Area
Purchase History
| Date | Buyer | Sale Price | Title Company |
|---|---|---|---|
| Fisher Amy K | -- | None Available | |
| Ramirez Pedro S | $165,000 | -- | |
| Turner Amy K | $116,400 | -- | |
| Turner Amy K | $116,400 | -- | |
| Reger Amy S | $109,000 | Lawyers Title Insurance Corp |
Source: Public Records
Mortgage History
| Date | Status | Borrower | Loan Amount |
|---|---|---|---|
| Open | Fisher Amy K | $134,498 | |
| Closed | Turner Amy K | $101,400 |
Source: Public Records
Tax History Compared to Growth
Tax History
| Year | Tax Paid | Tax Assessment Tax Assessment Total Assessment is a certain percentage of the fair market value that is determined by local assessors to be the total taxable value of land and additions on the property. | Land | Improvement |
|---|---|---|---|---|
| 2024 | $4,047 | $65,020 | $13,940 | $51,080 |
| 2023 | $4,047 | $65,020 | $13,940 | $51,080 |
| 2022 | $3,850 | $48,900 | $10,490 | $38,410 |
| 2021 | $3,562 | $48,900 | $10,490 | $38,410 |
| 2020 | $3,574 | $48,900 | $10,490 | $38,410 |
| 2019 | $3,448 | $41,720 | $9,520 | $32,200 |
| 2018 | $3,467 | $41,720 | $9,520 | $32,200 |
| 2017 | $3,194 | $41,720 | $9,520 | $32,200 |
| 2016 | $3,357 | $41,230 | $9,520 | $31,710 |
| 2015 | $3,208 | $41,230 | $9,520 | $31,710 |
| 2014 | $3,208 | $41,230 | $9,520 | $31,710 |
| 2012 | -- | $40,680 | $9,480 | $31,200 |
Source: Public Records
Map
Nearby Homes
- 651 Broad Blvd
- 663 Broad Blvd
- 2817 Royalston Ave
- 2701 Aerial Ave
- 2601 Oakley Ave
- 545 Monteray Ave
- 709 E Dorothy Ln
- 2820 Wehrly Ave
- 2551 Acorn Dr
- 445 Peach Orchard Ave
- 2119 Shroyer Rd
- 436 Monteray Ave
- 2004 Shroyer Rd
- 349 Orchard Dr
- 538 Wiltshire Blvd
- 962 Broad Blvd
- 651 Wiltshire Blvd
- 1916 Shroyer Rd
- 2905 Acorn Dr
- 401 Hadley Ave
- 2709 Oak Park Ave
- 2701 Oak Park Ave
- 2721 Oak Park Ave
- 2708 Delmonte Ave
- 2716 Delmonte Ave
- 2729 Oak Park Ave
- 2712 Oak Park Ave
- 2700 Oak Park Ave
- 2720 Oak Park Ave
- 2724 Delmonte Ave
- 2724 Oak Park Ave
- 2637 Oak Park Ave
- 637 Broad Blvd
- 641 Broad Blvd
- 633 Broad Blvd
- 625 Orchard Dr
- 629 Broad Blvd
- 625 Orchard Dr
- 2713 Hazelwood Ave
- 2721 Hazelwood Ave