2715 73rd St Kenosha, WI 53143
Saint Joes NeighborhoodEstimated Value: $201,000 - $241,000
2
Beds
1
Bath
1,040
Sq Ft
$210/Sq Ft
Est. Value
About This Home
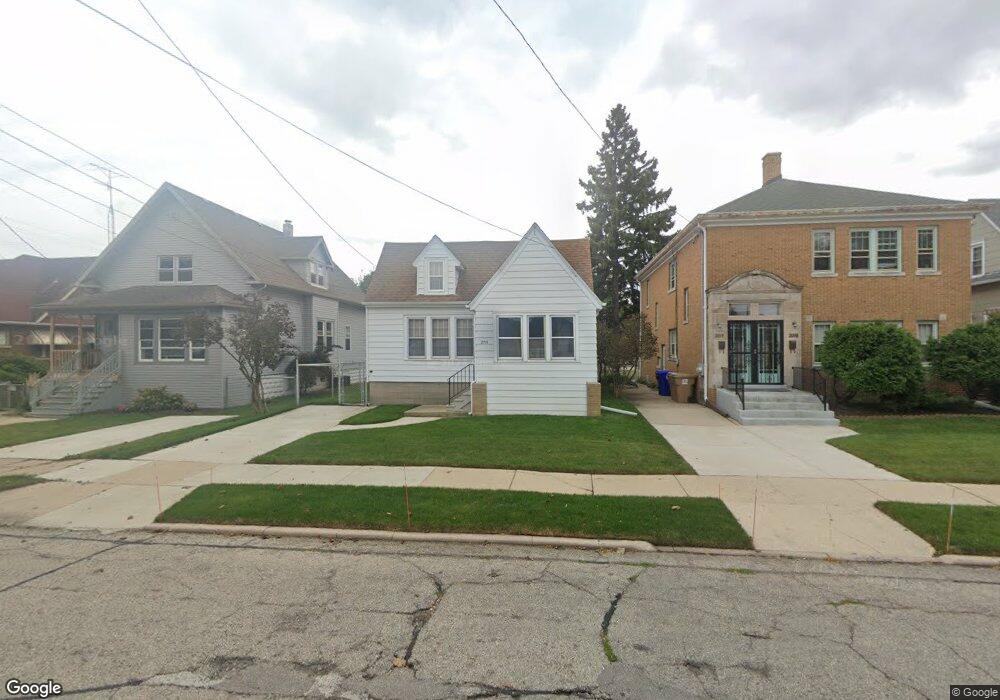
This home is located at 2715 73rd St, Kenosha, WI 53143 and is currently estimated at $218,011, approximately $209 per square foot. 2715 73rd St is a home located in Kenosha County with nearby schools including Grewenow Elementary School, Lincoln Middle School, and Tremper High School.
Ownership History
Date
Name
Owned For
Owner Type
Purchase Details
Closed on
Jan 22, 2019
Sold by
Everts Alice
Bought by
Everts Trust
Current Estimated Value
Purchase Details
Closed on
Dec 19, 2018
Sold by
Krueger George
Bought by
Everts Alice
Purchase Details
Closed on
Dec 27, 2005
Sold by
Krueger George and Everts Alice
Bought by
Krueger George and Everts Alice
Purchase Details
Closed on
Dec 1, 2005
Sold by
Krueger George and Everts Alice
Bought by
Krueger George and Everts Alice
Create a Home Valuation Report for This Property
The Home Valuation Report is an in-depth analysis detailing your home's value as well as a comparison with similar homes in the area
Home Values in the Area
Average Home Value in this Area
Purchase History
| Date | Buyer | Sale Price | Title Company |
|---|---|---|---|
| Everts Trust | -- | None Available | |
| Everts Alice | $50,000 | None Available | |
| Krueger George | -- | None Available | |
| Krueger George | -- | None Available |
Source: Public Records
Tax History Compared to Growth
Tax History
| Year | Tax Paid | Tax Assessment Tax Assessment Total Assessment is a certain percentage of the fair market value that is determined by local assessors to be the total taxable value of land and additions on the property. | Land | Improvement |
|---|---|---|---|---|
| 2024 | $2,520 | $103,400 | $18,800 | $84,600 |
| 2023 | $2,520 | $103,400 | $18,800 | $84,600 |
| 2022 | $2,543 | $103,400 | $18,800 | $84,600 |
| 2021 | $2,629 | $103,400 | $18,800 | $84,600 |
| 2020 | $2,677 | $103,400 | $18,800 | $84,600 |
| 2019 | $2,587 | $103,400 | $18,800 | $84,600 |
| 2018 | $2,539 | $94,000 | $18,800 | $75,200 |
| 2017 | $2,525 | $94,000 | $18,800 | $75,200 |
| 2016 | $2,474 | $94,000 | $18,800 | $75,200 |
| 2015 | $2,441 | $89,500 | $20,800 | $68,700 |
| 2014 | $2,429 | $89,500 | $20,800 | $68,700 |
Source: Public Records
Map
Nearby Homes