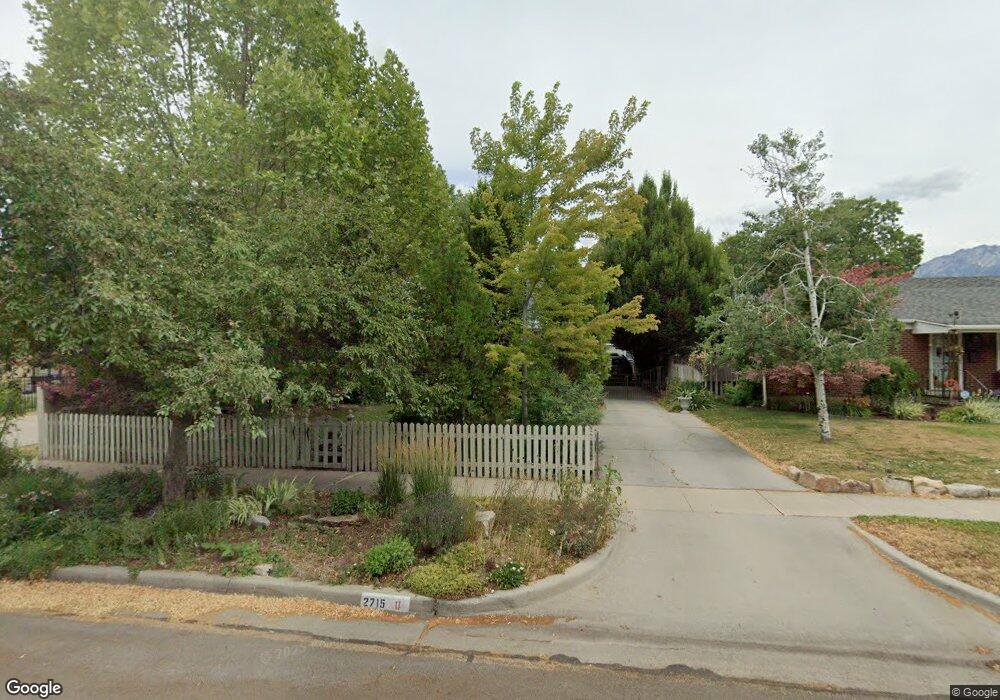
2715 Filmore St Salt Lake City, UT 84106
Sugar House NeighborhoodEstimated Value: $606,000 - $698,000
4
Beds
1
Bath
953
Sq Ft
$682/Sq Ft
Est. Value
About This Home
This home is located at 2715 Filmore St, Salt Lake City, UT 84106 and is currently estimated at $650,045, approximately $682 per square foot. 2715 Filmore St is a home located in Salt Lake County with nearby schools including Highland Park Elementary School, Hillside Middle School, and Highland High School.
Ownership History
Date
Name
Owned For
Owner Type
Purchase Details
Closed on
Feb 9, 1996
Sold by
Mckeever John B and Mckeever Carolyn Sue
Bought by
Leikam David Wayne and Leikam Tracee Perkins
Current Estimated Value
Home Financials for this Owner
Home Financials are based on the most recent Mortgage that was taken out on this home.
Original Mortgage
$83,000
Interest Rate
7.14%
Create a Home Valuation Report for This Property
The Home Valuation Report is an in-depth analysis detailing your home's value as well as a comparison with similar homes in the area
Home Values in the Area
Average Home Value in this Area
Purchase History
| Date | Buyer | Sale Price | Title Company |
|---|---|---|---|
| Leikam David Wayne | -- | -- |
Source: Public Records
Mortgage History
| Date | Status | Borrower | Loan Amount |
|---|---|---|---|
| Previous Owner | Leikam David Wayne | $83,000 |
Source: Public Records
Tax History Compared to Growth
Tax History
| Year | Tax Paid | Tax Assessment Tax Assessment Total Assessment is a certain percentage of the fair market value that is determined by local assessors to be the total taxable value of land and additions on the property. | Land | Improvement |
|---|---|---|---|---|
| 2025 | $2,794 | $550,900 | $205,000 | $345,900 |
| 2024 | $2,794 | $533,200 | $198,700 | $334,500 |
| 2023 | $2,625 | $482,700 | $164,200 | $318,500 |
| 2022 | $2,910 | $502,200 | $161,000 | $341,200 |
| 2021 | $2,581 | $403,200 | $123,800 | $279,400 |
| 2020 | $2,498 | $371,400 | $113,500 | $257,900 |
| 2019 | $2,347 | $328,400 | $106,400 | $222,000 |
| 2018 | $2,204 | $300,300 | $106,400 | $193,900 |
| 2017 | $2,267 | $289,300 | $106,400 | $182,900 |
| 2016 | $2,095 | $253,900 | $106,400 | $147,500 |
| 2015 | $2,102 | $241,500 | $105,400 | $136,100 |
| 2014 | $2,026 | $230,900 | $103,200 | $127,700 |
Source: Public Records
Map
Nearby Homes
- 2795 S Imperial St
- 2689 S 1700 E
- 2643 S 1700 E
- 1582 E Zenith Ave
- 2534 S Imperial St
- 2865 S 1335 E
- 1371 E Zenith Ave
- 2649 S 1800 E
- 2719 S Melbourne St
- 2486 S Imperial St
- 2546 S 1800 E
- 1314 E Crandall Ave
- 2692 Wellington St E
- 1821 Bosham Ln S
- 1838 E Hillcrest Ave
- 1190 E 2700 S Unit A4
- 1190 E 2700 S Unit A1
- 1192 E 2700 S
- 3026 S Crescent Dr
- 2692 Preston St
- 2723 S Filmore St
- 1552 E 2700 S
- 2723 Filmore St
- 2731 Filmore St
- 2731 S Filmore St
- 2720 S Glenmare St
- 2720 Glenmare St
- 2722 Glenmare St
- 2710 S Glenmare St
- 2710 Glenmare St
- 2728 Glenmare St
- 2704 Glenmare St
- 2704 S Glenmare St
- 2737 Filmore St
- 2744 S Glenmare St
- 2744 Glenmare St
- 2745 S Filmore St
- 2745 Filmore St
- 1527 E 2700 S
- 2699 Filmore St