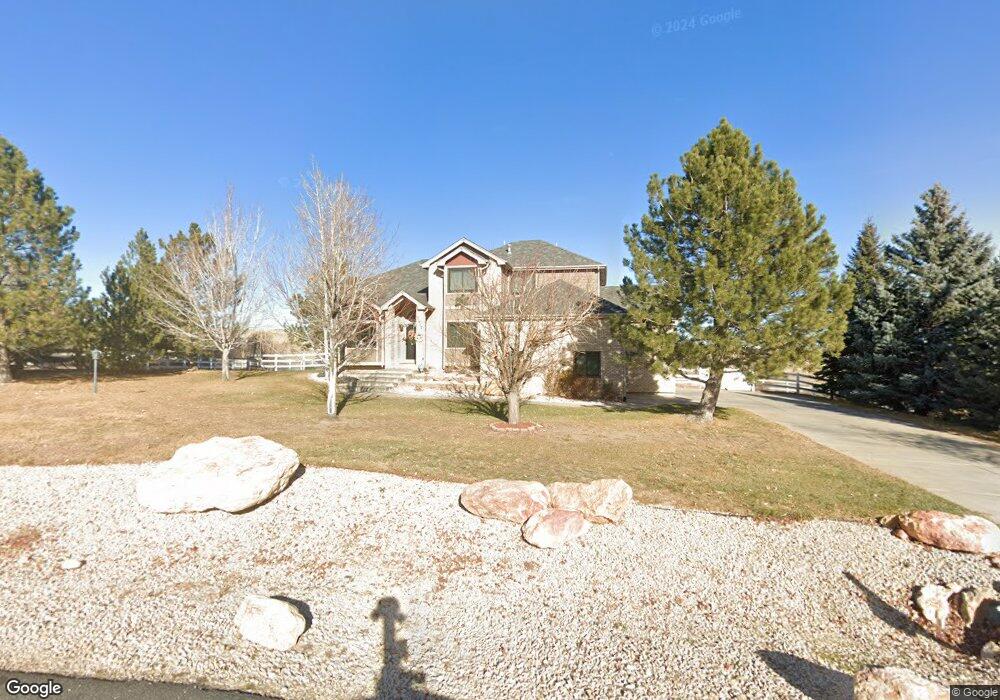
2717 Kyle Cir Loveland, CO 80537
Estimated Value: $941,151 - $1,062,000
5
Beds
3
Baths
2,922
Sq Ft
$339/Sq Ft
Est. Value
About This Home
This home is located at 2717 Kyle Cir, Loveland, CO 80537 and is currently estimated at $989,538, approximately $338 per square foot. 2717 Kyle Cir is a home located in Larimer County with nearby schools including Carrie Martin Elementary School, Walt Clark Middle School, and Thompson Valley High School.
Ownership History
Date
Name
Owned For
Owner Type
Purchase Details
Closed on
Apr 9, 2018
Sold by
Decker Phillip C and Decker Debra L
Bought by
Peterman Ryan R and Peterman Megan B
Current Estimated Value
Home Financials for this Owner
Home Financials are based on the most recent Mortgage that was taken out on this home.
Original Mortgage
$500,000
Outstanding Balance
$429,892
Interest Rate
4.43%
Mortgage Type
New Conventional
Estimated Equity
$559,646
Purchase Details
Closed on
Sep 11, 1998
Sold by
Harbison Phillip L and Harbison Roberta I
Bought by
Decker Phillip C and Decker Debra L
Home Financials for this Owner
Home Financials are based on the most recent Mortgage that was taken out on this home.
Original Mortgage
$212,000
Interest Rate
6.95%
Purchase Details
Closed on
Jan 1, 1996
Sold by
Harbison Phillip L
Bought by
Harbison Roberta I
Purchase Details
Closed on
Sep 1, 1993
Sold by
Libco Inc
Bought by
Harbison Phillip L
Purchase Details
Closed on
Dec 1, 1992
Sold by
Crowder Elizabeth A
Bought by
Libco Inc
Create a Home Valuation Report for This Property
The Home Valuation Report is an in-depth analysis detailing your home's value as well as a comparison with similar homes in the area
Home Values in the Area
Average Home Value in this Area
Purchase History
| Date | Buyer | Sale Price | Title Company |
|---|---|---|---|
| Peterman Ryan R | $635,000 | First American | |
| Decker Phillip C | $299,000 | First American Heritage Titl | |
| Harbison Roberta I | -- | -- | |
| Harbison Phillip L | $43,900 | -- | |
| Libco Inc | -- | -- |
Source: Public Records
Mortgage History
| Date | Status | Borrower | Loan Amount |
|---|---|---|---|
| Open | Peterman Ryan R | $500,000 | |
| Previous Owner | Decker Phillip C | $212,000 |
Source: Public Records
Tax History Compared to Growth
Tax History
| Year | Tax Paid | Tax Assessment Tax Assessment Total Assessment is a certain percentage of the fair market value that is determined by local assessors to be the total taxable value of land and additions on the property. | Land | Improvement |
|---|---|---|---|---|
| 2025 | $4,876 | $56,910 | $11,055 | $45,855 |
| 2024 | $4,906 | $56,910 | $11,055 | $45,855 |
| 2022 | $3,930 | $42,521 | $11,468 | $31,053 |
| 2021 | $3,947 | $43,744 | $11,798 | $31,946 |
| 2020 | $3,383 | $37,488 | $11,798 | $25,690 |
| 2019 | $3,332 | $37,488 | $11,798 | $25,690 |
| 2018 | $3,435 | $36,914 | $11,880 | $25,034 |
| 2017 | $3,016 | $36,914 | $11,880 | $25,034 |
| 2016 | $2,734 | $32,509 | $13,134 | $19,375 |
| 2015 | $2,779 | $32,500 | $13,130 | $19,370 |
| 2014 | $2,903 | $33,010 | $7,160 | $25,850 |
Source: Public Records
Map
Nearby Homes
- 2909 Pronghorn Ct
- 3020 Blue Mountain Ct
- 2272 Golden Valley Rd
- 5714 Bluff Ln
- 2712 S County Road 29
- 6950 W County Road 18
- 6819 W County Road 18
- 4260 S County Road 23
- 1016 Meadowridge Ct
- 1350 S County Road 29
- 5794 Jackdaw Dr
- 613 Cove Dr
- 940 S County Road 29
- 4400 Sedona Hills Dr
- 459 Cape Dory Dr
- 270 Meadowsweet Cir
- 4121 Silene Place
- 5360 Lighthouse Point Ct
- 347 Meadowsweet Cir
- 6811 W County Road 20
- 2717 Kyle Cir
- 2747 Kyle Cir
- 2747 Kyle Cir
- 6205 Kelly Beth Ct
- 2750 Kyle Cir
- 2720 Kyle Cir
- 2761 Kyle Cir
- 2761 Kyle Cir
- 6127 Kelly Beth Ct
- 2782 Kyle Cir
- 2651 Kyle Cir
- 2651 Kyle Cir
- 2801 Kyle Cir
- 6115 Kelly Beth Ct
- 6126 Kelly Beth Ct
- 2800 Kyle Cir
- 6114 Kelly Beth Ct
- 2829 Kyle Cir
- 6103 Kelly Beth Ct
- 6233 Jordan Dr