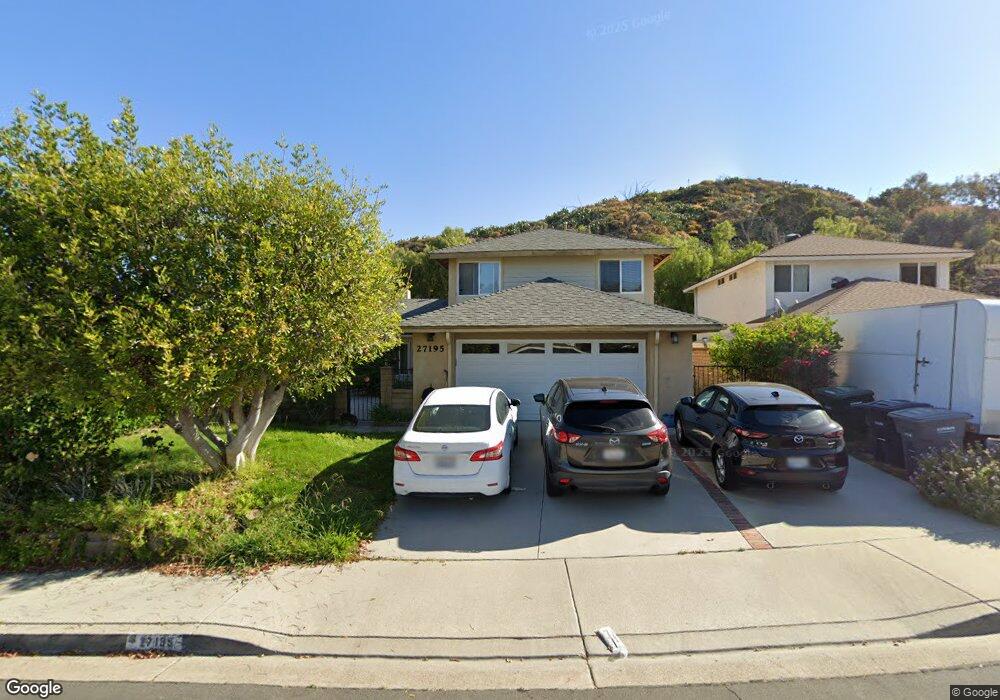
27195 Valleymont Rd Lake Forest, CA 92630
Estimated Value: $1,154,577 - $1,241,000
4
Beds
3
Baths
1,644
Sq Ft
$723/Sq Ft
Est. Value
About This Home
This home is located at 27195 Valleymont Rd, Lake Forest, CA 92630 and is currently estimated at $1,188,644, approximately $723 per square foot. 27195 Valleymont Rd is a home located in Orange County with nearby schools including Lake Forest Elementary School, Serrano Intermediate School, and Trabuco Hills High School.
Ownership History
Date
Name
Owned For
Owner Type
Purchase Details
Closed on
Apr 4, 2025
Sold by
Hussein Abir M and Elshenawi Osama M
Bought by
Hussein Abir M
Current Estimated Value
Purchase Details
Closed on
Apr 14, 2011
Sold by
Hussein Abir M
Bought by
Hussein Abir M and Elshenawi Osama M
Home Financials for this Owner
Home Financials are based on the most recent Mortgage that was taken out on this home.
Original Mortgage
$345,000
Interest Rate
4.83%
Mortgage Type
New Conventional
Purchase Details
Closed on
Mar 1, 2004
Sold by
Hussein Abir M and Elshenawi Osama
Bought by
Hussein Abir M
Purchase Details
Closed on
Nov 16, 1998
Sold by
Hosameldin Elshenawi and Hosameldin Osama
Bought by
Hussein Abir M
Home Financials for this Owner
Home Financials are based on the most recent Mortgage that was taken out on this home.
Original Mortgage
$192,996
Interest Rate
6.91%
Mortgage Type
FHA
Create a Home Valuation Report for This Property
The Home Valuation Report is an in-depth analysis detailing your home's value as well as a comparison with similar homes in the area
Home Values in the Area
Average Home Value in this Area
Purchase History
| Date | Buyer | Sale Price | Title Company |
|---|---|---|---|
| Hussein Abir M | -- | None Listed On Document | |
| Hussein Abir M | -- | Chicago Title | |
| Hussein Abir M | -- | Orange Coast Title Of Los An | |
| Hussein Abir M | $200,000 | Commonwealth Land Title |
Source: Public Records
Mortgage History
| Date | Status | Borrower | Loan Amount |
|---|---|---|---|
| Previous Owner | Hussein Abir M | $345,000 | |
| Previous Owner | Hussein Abir M | $192,996 |
Source: Public Records
Tax History Compared to Growth
Tax History
| Year | Tax Paid | Tax Assessment Tax Assessment Total Assessment is a certain percentage of the fair market value that is determined by local assessors to be the total taxable value of land and additions on the property. | Land | Improvement |
|---|---|---|---|---|
| 2025 | $3,181 | $313,534 | $146,783 | $166,751 |
| 2024 | $3,181 | $307,387 | $143,905 | $163,482 |
| 2023 | $3,106 | $301,360 | $141,083 | $160,277 |
| 2022 | $3,051 | $295,451 | $138,316 | $157,135 |
| 2021 | $2,990 | $289,658 | $135,604 | $154,054 |
| 2020 | $2,964 | $286,688 | $134,213 | $152,475 |
| 2019 | $2,905 | $281,067 | $131,581 | $149,486 |
| 2018 | $2,851 | $275,556 | $129,001 | $146,555 |
| 2017 | $2,794 | $270,153 | $126,471 | $143,682 |
| 2016 | $2,748 | $264,856 | $123,991 | $140,865 |
| 2015 | $2,714 | $260,878 | $122,128 | $138,750 |
| 2014 | $2,655 | $255,768 | $119,735 | $136,033 |
Source: Public Records
Map
Nearby Homes
- 27191 Valleymont Rd
- 27122 Valleymont Rd
- 21076 Cranbridge Dr
- 21282 Hillside Ct
- 21055 Carob Ln
- 21441 Montbury Dr
- 27651 White Fir Ln
- 21822 Shenandoah Dr
- 27837 Violet Unit 152
- 20702 El Toro Rd Unit 271
- 20702 El Toro Rd Unit 325
- 20702 El Toro Rd Unit 413
- 20702 El Toro Rd Unit 244
- 20702 El Toro Rd Unit 379
- 20702 El Toro Rd Unit 243
- 26474 Sagewood Unit 14
- 21175 Tangerine Unit 119
- 21902 Raintree Ln
- 21642 Montbury Dr
- 21952 Esplendor
- 27201 Valleymont Rd
- 27181 Valleymont Rd
- 27211 Valleymont Rd
- 27171 Valleymont Rd
- 27192 Valleymont Rd
- 27186 Valleymont Rd
- 27202 Valleymont Rd
- 27182 Valleymont Rd
- 27222 Valleymont Rd
- 27172 Valleymont Rd
- 27161 Valleymont Rd
- 27206 Valleymont Rd
- 27212 Valleymont Rd
- 27152 Valleymont Rd
- 27151 Valleymont Rd
- 27142 Valleymont Rd
- 27141 Valleymont Rd
- 27132 Valleymont Rd
- 27172 Ashton Cir
- 21182 Cranbridge Dr