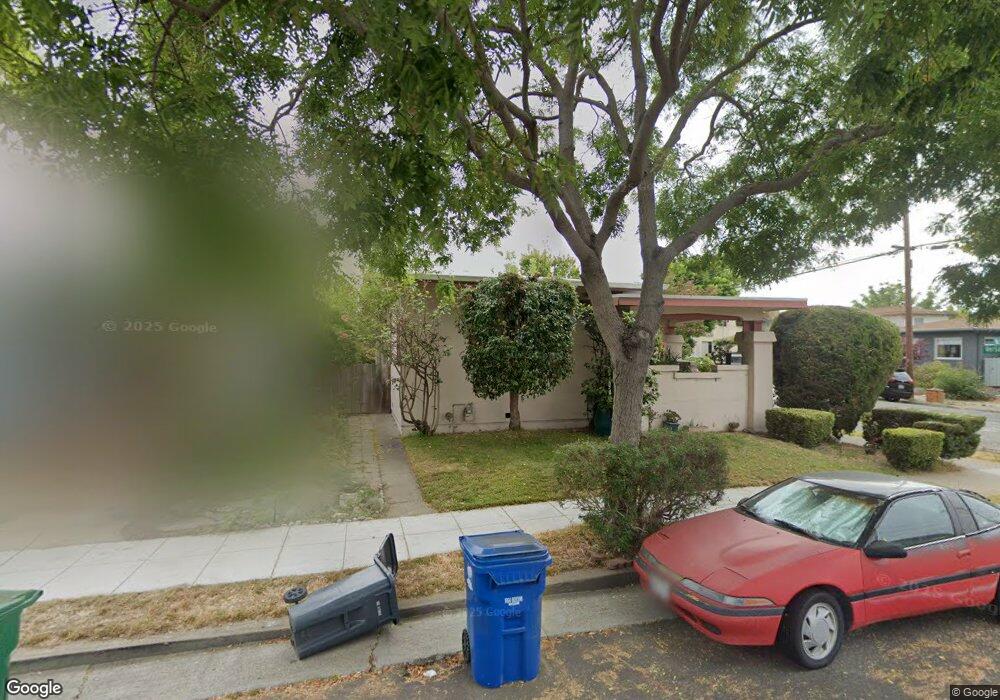
2721 Washington St Alameda, CA 94501
South Shore NeighborhoodEstimated Value: $1,055,798 - $1,383,000
3
Beds
5
Baths
1,286
Sq Ft
$926/Sq Ft
Est. Value
About This Home
This home is located at 2721 Washington St, Alameda, CA 94501 and is currently estimated at $1,190,200, approximately $925 per square foot. 2721 Washington St is a home located in Alameda County with nearby schools including Frank Otis Elementary School, Lincoln Middle School, and Alameda High School.
Ownership History
Date
Name
Owned For
Owner Type
Purchase Details
Closed on
Aug 19, 2010
Sold by
Reaney Max T and Reaney Phyllis L
Bought by
Reaney Max T and Reaney Phyllis L
Current Estimated Value
Home Financials for this Owner
Home Financials are based on the most recent Mortgage that was taken out on this home.
Original Mortgage
$75,000
Interest Rate
4.52%
Mortgage Type
New Conventional
Purchase Details
Closed on
Sep 11, 2006
Sold by
Reaney Max T and Reaney Phyllis L
Bought by
Reaney Max T and Reaney Phyllis L
Home Financials for this Owner
Home Financials are based on the most recent Mortgage that was taken out on this home.
Original Mortgage
$46,000
Interest Rate
6.51%
Mortgage Type
New Conventional
Purchase Details
Closed on
Nov 29, 2000
Sold by
Reaney Max T and Reaney Phyllis L
Bought by
Reaney Max T and Reaney Phyllis L
Create a Home Valuation Report for This Property
The Home Valuation Report is an in-depth analysis detailing your home's value as well as a comparison with similar homes in the area
Home Values in the Area
Average Home Value in this Area
Purchase History
| Date | Buyer | Sale Price | Title Company |
|---|---|---|---|
| Reaney Max T | -- | None Available | |
| Reaney Max T | -- | Lawyers Title | |
| Reaney Max T | -- | Lsi Title Company | |
| Reaney Max T | -- | Lsi Title Company | |
| Reaney Max T | -- | -- |
Source: Public Records
Mortgage History
| Date | Status | Borrower | Loan Amount |
|---|---|---|---|
| Closed | Reaney Max T | $75,000 | |
| Closed | Reaney Max T | $46,000 |
Source: Public Records
Tax History Compared to Growth
Tax History
| Year | Tax Paid | Tax Assessment Tax Assessment Total Assessment is a certain percentage of the fair market value that is determined by local assessors to be the total taxable value of land and additions on the property. | Land | Improvement |
|---|---|---|---|---|
| 2025 | $2,465 | $105,974 | $83,168 | $29,806 |
| 2024 | $2,465 | $103,758 | $81,537 | $29,221 |
| 2023 | $2,381 | $108,587 | $79,939 | $28,648 |
| 2022 | $2,324 | $99,457 | $78,371 | $28,086 |
| 2021 | $2,270 | $97,371 | $76,835 | $27,536 |
| 2020 | $2,237 | $103,300 | $76,047 | $27,253 |
| 2019 | $2,140 | $101,275 | $74,556 | $26,719 |
| 2018 | $2,090 | $99,289 | $73,094 | $26,195 |
| 2017 | $2,017 | $97,343 | $71,661 | $25,682 |
| 2016 | $1,994 | $95,434 | $70,256 | $25,178 |
| 2015 | $1,978 | $94,001 | $69,201 | $24,800 |
| 2014 | $1,912 | $92,159 | $67,845 | $24,314 |
Source: Public Records
Map
Nearby Homes
- 2839 Washington St
- 1210 Broadway Unit A
- 2848 San Jose Ave
- 975 Pearl St
- 1238 Versailles Ave
- 2620 Encinal Ave
- 2829 Otis Dr
- 1024 Regent St
- 1100 Park Ave
- 3208 Washington St
- 3171 Bayview Dr
- 954 Park St
- 2431 Roosevelt Dr
- 3012 Bayview Dr
- 935 Park St
- 2417 Marti Rae Ct
- 840 Oak St
- 1251 Park St
- 3103 Central Ave
- 2308 Encinal Ave
- 2717 Washington St
- 1109 Versailles Ave
- 2715 Washington St
- 1113 Versailles Ave
- 1110 Versailles Ave
- 2711 Washington St
- 1114 Versailles Ave
- 1100 Versailles Ave
- 2722 Washington St
- 1117 Versailles Ave
- 1118 Versailles Ave
- 2718 Washington St
- 2709 Washington St
- 1122 Versailles Ave
- 2712 Washington St
- 1121 Versailles Ave
- 1098 Versailles Ave
- 1108 Pearl St
- 1124 Versailles Ave
- 1109 College Ave