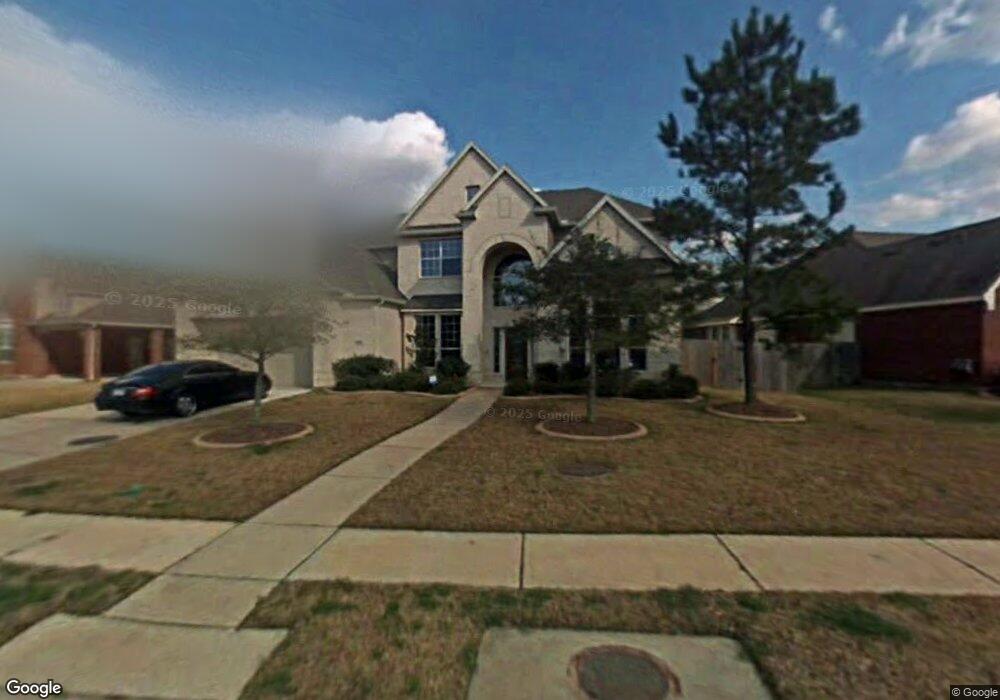
2723 Zachary Bend Ln Katy, TX 77494
Falcon Landing NeighborhoodEstimated Value: $786,794 - $843,000
5
Beds
4
Baths
4,686
Sq Ft
$173/Sq Ft
Est. Value
About This Home
This home is located at 2723 Zachary Bend Ln, Katy, TX 77494 and is currently estimated at $811,699, approximately $173 per square foot. 2723 Zachary Bend Ln is a home located in Fort Bend County with nearby schools including Michael L. Griffin Elementary School, Cinco Ranch Junior High, and Cinco Ranch High School.
Ownership History
Date
Name
Owned For
Owner Type
Purchase Details
Closed on
Oct 16, 2007
Sold by
Priority Relocation Co Llc
Bought by
Cabella Vincent
Current Estimated Value
Home Financials for this Owner
Home Financials are based on the most recent Mortgage that was taken out on this home.
Original Mortgage
$394,250
Outstanding Balance
$249,469
Interest Rate
6.47%
Mortgage Type
New Conventional
Estimated Equity
$562,230
Purchase Details
Closed on
Aug 2, 2006
Sold by
Eby Carl W and Eby Donna R
Bought by
Priority Relocation Co Llc
Purchase Details
Closed on
Jan 16, 2003
Sold by
Weekley Homes Lp
Bought by
Eby Carl W and Eby Donna R
Home Financials for this Owner
Home Financials are based on the most recent Mortgage that was taken out on this home.
Original Mortgage
$200,000
Interest Rate
6%
Purchase Details
Closed on
May 31, 2002
Sold by
Westbrook Cinco West Lp
Bought by
Weekley Homes Lp
Create a Home Valuation Report for This Property
The Home Valuation Report is an in-depth analysis detailing your home's value as well as a comparison with similar homes in the area
Home Values in the Area
Average Home Value in this Area
Purchase History
| Date | Buyer | Sale Price | Title Company |
|---|---|---|---|
| Cabella Vincent | -- | Priority Title Co | |
| Priority Relocation Co Llc | -- | Priority Title Co | |
| Cabella Vincent | -- | -- | |
| Eby Carl W | -- | Priority Title Co | |
| Cabella Vincent | -- | -- | |
| Weekley Homes Lp | -- | Priority Title |
Source: Public Records
Mortgage History
| Date | Status | Borrower | Loan Amount |
|---|---|---|---|
| Open | Cabella Vincent | $394,250 | |
| Previous Owner | Cabella Vincent | $200,000 |
Source: Public Records
Tax History Compared to Growth
Tax History
| Year | Tax Paid | Tax Assessment Tax Assessment Total Assessment is a certain percentage of the fair market value that is determined by local assessors to be the total taxable value of land and additions on the property. | Land | Improvement |
|---|---|---|---|---|
| 2025 | $12,890 | $723,745 | $95,680 | $698,084 |
| 2024 | $12,890 | $657,950 | -- | $773,950 |
| 2023 | $11,943 | $598,136 | $0 | $781,600 |
| 2022 | $12,710 | $543,760 | $0 | $593,520 |
| 2021 | $13,092 | $494,330 | $73,600 | $420,730 |
| 2020 | $13,534 | $505,560 | $73,600 | $431,960 |
| 2019 | $14,527 | $524,330 | $73,600 | $450,730 |
| 2018 | $13,907 | $503,210 | $59,850 | $443,360 |
| 2017 | $13,980 | $504,950 | $59,850 | $445,100 |
| 2016 | $14,386 | $519,630 | $59,850 | $459,780 |
| 2015 | $10,528 | $502,910 | $59,850 | $443,060 |
| 2014 | $9,787 | $457,190 | $59,850 | $397,340 |
Source: Public Records
Map
Nearby Homes
- 2910 Lara Brook Ct
- 2911 Drews Manor Ct
- 2830 Noble Grove Ln
- 2915 Autumnglow Ct
- 24706 Bent Hollow Ln
- 2523 Falcon Knoll Ln
- 3022 Glenthorpe Ln
- 24815 High Desert Ln
- 2611 Sandy Mist Ct
- 2434 Ranch Hollow Ct
- 2606 Sandy Mist Ct
- 24519 Bell Canyon Ln
- 24718 Cobble Canyon Ln
- 2834 Feather Glen Ct
- 24907 Morning Raven Ln
- 24823 Cobble Canyon Ln
- 2218 Falcon Knoll Ln
- 25023 Ivy Trace Ln
- 24007 Northshire Ln
- 25002 Clover Ranch Dr
- 2719 Zachary Bend Ln
- 2727 Zachary Bend Ln
- 2706 Shannon Forest Ct
- 2715 Zachary Bend Ln
- 2731 Zachary Bend Ln
- 2702 Shannon Forest Ct
- 2802 Nicks Run Ln
- 2807 Nicks Run Ln
- 2710 Shannon Forest Ct
- 2718 Zachary Bend Ln
- 2707 Zachary Bend Ln
- 2902 Amy Shores Ct
- 2714 Zachary Bend Ln
- 2806 Nicks Run Ln
- 2811 Nicks Run Ln
- 2703 Shannon Forest Ct
- 2714 Shannon Forest Ct
- 2739 Zachary Bend Ln
- 2710 Zachary Bend Ln
- 2906 Amy Shores Ct