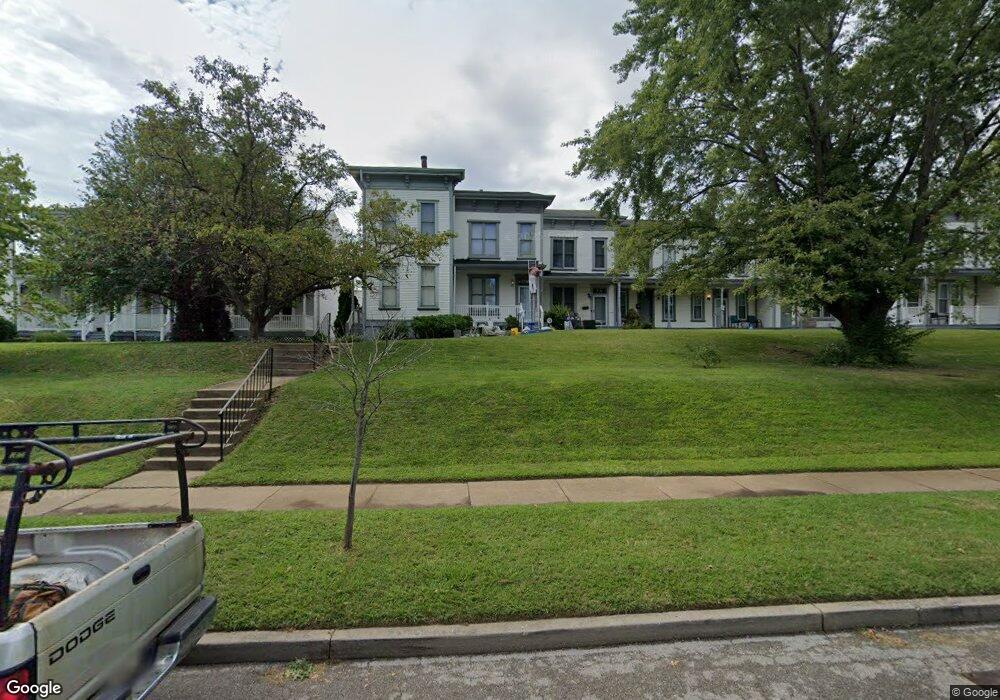
2726 Park Ave Saint Louis, MO 63104
The Gate NeighborhoodEstimated Value: $229,000 - $297,902
--
Bed
2
Baths
1,332
Sq Ft
$202/Sq Ft
Est. Value
About This Home
This home is located at 2726 Park Ave, Saint Louis, MO 63104 and is currently estimated at $269,226, approximately $202 per square foot. 2726 Park Ave is a home located in St. Louis City with nearby schools including Hodgen Elementary School, Vashon High School, and New American Preparatory Academy.
Ownership History
Date
Name
Owned For
Owner Type
Purchase Details
Closed on
Feb 8, 2016
Sold by
Boyet Sharon A
Bought by
Davis Caressa J
Current Estimated Value
Purchase Details
Closed on
Jun 23, 2006
Sold by
Phung Anthony Huy and Phung Timothy V
Bought by
The Sharon A Boyet Living Trust
Purchase Details
Closed on
Aug 2, 2005
Sold by
James Briesacher P
Bought by
Phung Anthony Huy and Phung William Vinh
Purchase Details
Closed on
Apr 17, 2003
Sold by
Mcgahey James
Bought by
Mcgahey James Dell and James Dell Mcgahey Revocable Living Tr
Purchase Details
Closed on
Sep 23, 2002
Sold by
Nelson Kim M and Nelson Herman
Bought by
Mcgahey James
Purchase Details
Closed on
Jul 28, 2000
Sold by
Wylie Janet L
Bought by
Prater Kim A
Home Financials for this Owner
Home Financials are based on the most recent Mortgage that was taken out on this home.
Original Mortgage
$83,436
Interest Rate
8.15%
Mortgage Type
FHA
Create a Home Valuation Report for This Property
The Home Valuation Report is an in-depth analysis detailing your home's value as well as a comparison with similar homes in the area
Home Values in the Area
Average Home Value in this Area
Purchase History
| Date | Buyer | Sale Price | Title Company |
|---|---|---|---|
| Davis Caressa J | -- | None Available | |
| The Sharon A Boyet Living Trust | -- | Atc | |
| Phung Anthony Huy | -- | Clt | |
| Mcgahey James Dell | -- | -- | |
| Mcgahey James | -- | -- | |
| Prater Kim A | -- | -- |
Source: Public Records
Mortgage History
| Date | Status | Borrower | Loan Amount |
|---|---|---|---|
| Previous Owner | Prater Kim A | $83,436 |
Source: Public Records
Tax History Compared to Growth
Tax History
| Year | Tax Paid | Tax Assessment Tax Assessment Total Assessment is a certain percentage of the fair market value that is determined by local assessors to be the total taxable value of land and additions on the property. | Land | Improvement |
|---|---|---|---|---|
| 2025 | $2,699 | $35,320 | $860 | $34,460 |
| 2024 | $2,568 | $31,910 | $860 | $31,050 |
| 2023 | $2,568 | $31,910 | $860 | $31,050 |
| 2022 | $2,411 | $28,830 | $860 | $27,970 |
| 2021 | $2,408 | $28,830 | $860 | $27,970 |
| 2020 | $2,275 | $27,440 | $860 | $26,580 |
| 2019 | $2,268 | $27,440 | $860 | $26,580 |
| 2018 | $1,832 | $21,440 | $860 | $20,580 |
| 2017 | $1,773 | $21,430 | $860 | $20,580 |
| 2016 | $1,194 | $14,250 | $510 | $13,740 |
| 2015 | $1,082 | $14,250 | $510 | $13,740 |
| 2014 | $960 | $16,980 | $510 | $16,470 |
| 2013 | -- | $12,650 | $510 | $12,140 |
Source: Public Records
Map
Nearby Homes
- 2654 Park Ave
- 2622 Park Ave Unit A
- 2843 Saint Vincent Ave
- 2906 Park Ave
- 2352 Albion Place Unit 2W
- 2610 Rutger St
- 2327 Park Ave
- 2336 Rutger St Unit B
- 2350 Hickory St
- 2317 Park Ave
- 1725 Oregon Place
- 2320 Rutger St Unit E
- 2326 Hickory St
- 2311 Rutger St Unit C
- 1908 California Ave
- 2646 Geyer Ave
- 1901 Oregon Ave
- 3130 Caroline St
- 2633 Allen Ave
- 1225 Mackay Place
- 2726 Park Ave Unit 14
- 2724 Park Ave
- 2728 Park Ave
- 2730 Park Ave
- 2722 Park Ave
- 2732 Park Ave
- 2720 Park Ave
- 2734 Park Ave
- 2718 Park Ave
- 2736 Park Ave
- 2716 Park Ave
- 2738 Park Ave
- 2714 Park Ave
- 2740 Park Ave
- 2725 Saint Vincent Ave
- 2712 Park Ave
- 2712 Park Ave Unit 7
- 2729 Saint Vincent Ave
- 2721 Saint Vincent Ave
- 2742 Park Ave