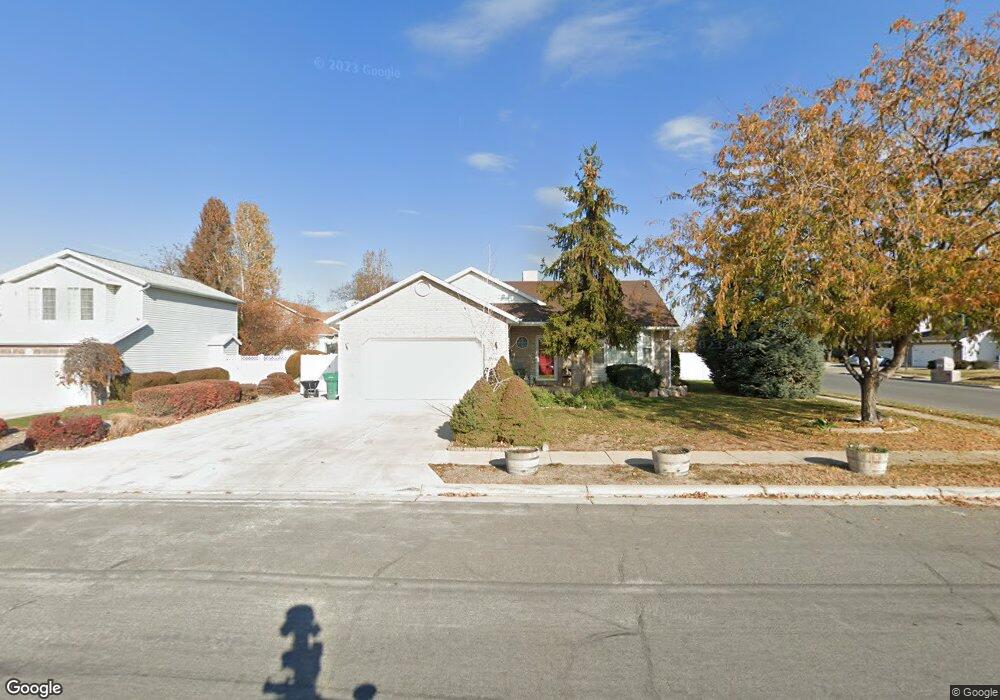
2730 W Lindi Way Layton, UT 84041
Estimated Value: $485,000 - $519,000
5
Beds
3
Baths
2,662
Sq Ft
$189/Sq Ft
Est. Value
About This Home
This home is located at 2730 W Lindi Way, Layton, UT 84041 and is currently estimated at $504,127, approximately $189 per square foot. 2730 W Lindi Way is a home located in Davis County with nearby schools including Legacy Junior High School, Layton High School, and North Davis Preparatory Academy.
Ownership History
Date
Name
Owned For
Owner Type
Purchase Details
Closed on
Oct 16, 2024
Sold by
Ronald D Later & Louise H Later Trust and Later Ronald
Bought by
Oldham Casey
Current Estimated Value
Home Financials for this Owner
Home Financials are based on the most recent Mortgage that was taken out on this home.
Original Mortgage
$393,600
Outstanding Balance
$389,074
Interest Rate
6.35%
Mortgage Type
New Conventional
Estimated Equity
$115,053
Purchase Details
Closed on
Mar 27, 2018
Sold by
Later Ronald D and Later Louise H
Bought by
Later Ronald D and Later Trust
Purchase Details
Closed on
Dec 12, 2003
Sold by
Merrill Michael S and Merrill Kristen E
Bought by
Later Ronald D and Later Louise H
Purchase Details
Closed on
Jan 2, 1997
Sold by
Glauser Lynn
Bought by
Merrill Michael S and Merrill Kristen E
Home Financials for this Owner
Home Financials are based on the most recent Mortgage that was taken out on this home.
Original Mortgage
$119,888
Interest Rate
7.53%
Mortgage Type
FHA
Create a Home Valuation Report for This Property
The Home Valuation Report is an in-depth analysis detailing your home's value as well as a comparison with similar homes in the area
Home Values in the Area
Average Home Value in this Area
Purchase History
| Date | Buyer | Sale Price | Title Company |
|---|---|---|---|
| Oldham Casey | -- | Meridian Title | |
| Later Ronald D | -- | None Available | |
| Later Ronald D | -- | Mountain View Title & Escrow | |
| Merrill Michael S | -- | Security Title Company |
Source: Public Records
Mortgage History
| Date | Status | Borrower | Loan Amount |
|---|---|---|---|
| Open | Oldham Casey | $393,600 | |
| Previous Owner | Merrill Michael S | $119,888 |
Source: Public Records
Tax History Compared to Growth
Tax History
| Year | Tax Paid | Tax Assessment Tax Assessment Total Assessment is a certain percentage of the fair market value that is determined by local assessors to be the total taxable value of land and additions on the property. | Land | Improvement |
|---|---|---|---|---|
| 2025 | $2,536 | $266,200 | $100,900 | $165,300 |
| 2024 | $2,227 | $246,950 | $112,524 | $134,426 |
| 2023 | $2,227 | $415,000 | $109,529 | $305,471 |
| 2022 | $2,440 | $246,950 | $69,722 | $177,228 |
| 2021 | $2,219 | $335,000 | $104,616 | $230,384 |
| 2020 | $2,003 | $290,000 | $87,651 | $202,349 |
| 2019 | $1,939 | $275,000 | $90,994 | $184,006 |
| 2018 | $1,756 | $250,000 | $79,689 | $170,311 |
| 2016 | $1,637 | $120,230 | $30,770 | $89,460 |
| 2015 | $1,549 | $108,020 | $30,770 | $77,250 |
| 2014 | $1,540 | $109,791 | $30,770 | $79,021 |
| 2013 | -- | $103,152 | $28,952 | $74,200 |
Source: Public Records
Map
Nearby Homes