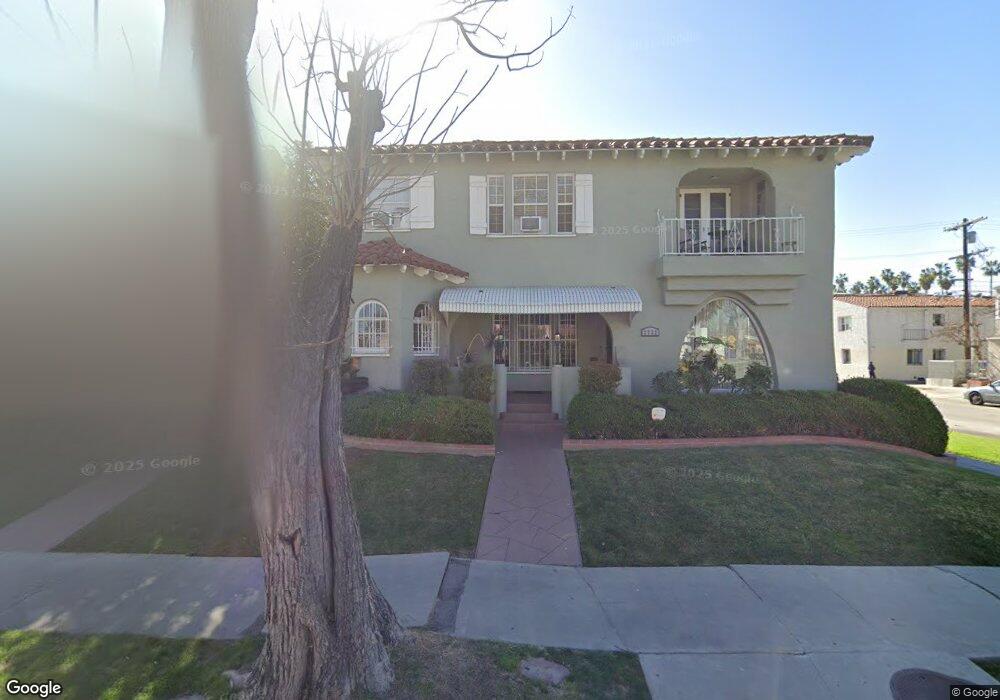
2732 W 43rd Place Los Angeles, CA 90008
Leimert Park NeighborhoodEstimated Value: $1,028,000 - $1,216,440
6
Beds
4
Baths
3,364
Sq Ft
$330/Sq Ft
Est. Value
About This Home
This home is located at 2732 W 43rd Place, Los Angeles, CA 90008 and is currently estimated at $1,111,610, approximately $330 per square foot. 2732 W 43rd Place is a home located in Los Angeles County with nearby schools including Forty-Second Street Elementary School, Audubon Middle School, and Crenshaw Science, Technology, Engineering, Math And Medicine Magnet.
Ownership History
Date
Name
Owned For
Owner Type
Purchase Details
Closed on
Feb 28, 2013
Sold by
Greene Stephen and Greene Bonnie
Bought by
Greene Stephen and Greene Bonnie
Current Estimated Value
Home Financials for this Owner
Home Financials are based on the most recent Mortgage that was taken out on this home.
Original Mortgage
$300,000
Outstanding Balance
$211,606
Interest Rate
3.53%
Mortgage Type
New Conventional
Estimated Equity
$900,004
Purchase Details
Closed on
Mar 3, 2012
Sold by
Greene Stephen R
Bought by
Greene Stephen and Greene Bonnie
Purchase Details
Closed on
Apr 24, 2000
Sold by
Parrish Trust Parrish Alvis W Iii Trs A An and White Adele W
Bought by
Greene Stephen R
Home Financials for this Owner
Home Financials are based on the most recent Mortgage that was taken out on this home.
Original Mortgage
$215,625
Interest Rate
8.25%
Create a Home Valuation Report for This Property
The Home Valuation Report is an in-depth analysis detailing your home's value as well as a comparison with similar homes in the area
Home Values in the Area
Average Home Value in this Area
Purchase History
| Date | Buyer | Sale Price | Title Company |
|---|---|---|---|
| Greene Stephen | -- | Lawyers Title | |
| Greene Stephen | -- | Lawyers Title | |
| Greene Stephen | -- | Lawyers Title | |
| Greene Stephen | -- | None Available | |
| Greene Stephen R | $288,000 | Fidelity Title |
Source: Public Records
Mortgage History
| Date | Status | Borrower | Loan Amount |
|---|---|---|---|
| Open | Greene Stephen | $300,000 | |
| Closed | Greene Stephen | $300,000 | |
| Closed | Greene Stephen R | $215,625 | |
| Closed | Greene Stephen R | $43,125 |
Source: Public Records
Tax History Compared to Growth
Tax History
| Year | Tax Paid | Tax Assessment Tax Assessment Total Assessment is a certain percentage of the fair market value that is determined by local assessors to be the total taxable value of land and additions on the property. | Land | Improvement |
|---|---|---|---|---|
| 2025 | $5,624 | $441,857 | $261,277 | $180,580 |
| 2024 | $5,624 | $433,194 | $256,154 | $177,040 |
| 2023 | $5,525 | $424,701 | $251,132 | $173,569 |
| 2022 | $5,281 | $416,374 | $246,208 | $170,166 |
| 2021 | $5,197 | $408,211 | $241,381 | $166,830 |
| 2019 | $5,047 | $396,105 | $234,222 | $161,883 |
| 2018 | $4,968 | $388,339 | $229,630 | $158,709 |
| 2016 | $4,722 | $373,262 | $220,714 | $152,548 |
| 2015 | $4,656 | $367,656 | $217,399 | $150,257 |
| 2014 | $4,683 | $360,455 | $213,141 | $147,314 |
Source: Public Records
Map
Nearby Homes
- 2800 W 43rd Place
- 2725 W Vernon Ave
- 2727 W 43rd Place
- 2718 W 43rd Place
- 2720 W 43rd Place
- 2719 W Vernon Ave
- 2806 W 43rd Place
- 2808 W 43rd Place Unit 2808
- 2721 W 43rd Place
- 2717 W Vernon Ave
- 2717 W Vernon Ave Unit 1/2
- 2801 W Vernon Ave
- 2713 W Vernon Ave
- 2714 W 43rd Place
- 2803 W 43rd Place
- 2810 W 43rd Place
- 2709 W Vernon Ave
- 2709 - 2711 W Vernon Ave
- 4322 Sutro Ave