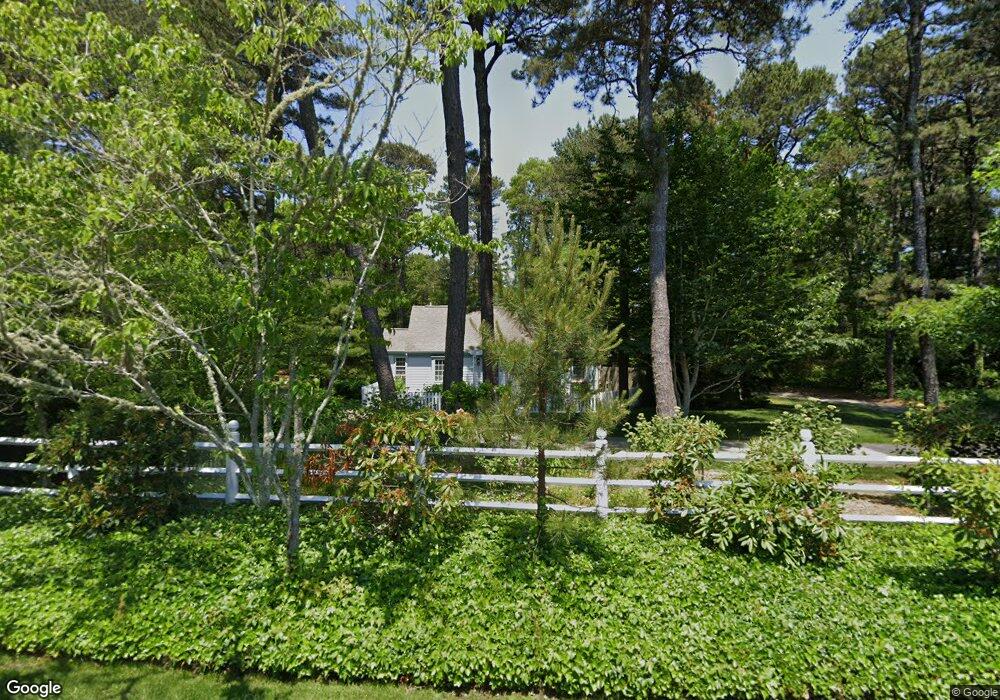
274 Bridge St Osterville, MA 02655
Osterville NeighborhoodEstimated Value: $4,353,000 - $7,305,950
4
Beds
5
Baths
3,324
Sq Ft
$1,616/Sq Ft
Est. Value
About This Home
This home is located at 274 Bridge St, Osterville, MA 02655 and is currently estimated at $5,369,983, approximately $1,615 per square foot. 274 Bridge St is a home located in Barnstable County with nearby schools including West Villages Elementary School, Barnstable United Elementary School, and Barnstable Intermediate School.
Ownership History
Date
Name
Owned For
Owner Type
Purchase Details
Closed on
Jun 8, 2001
Sold by
Surprenant Albert H
Bought by
5B Bridge St Rt
Current Estimated Value
Home Financials for this Owner
Home Financials are based on the most recent Mortgage that was taken out on this home.
Original Mortgage
$2,560,000
Outstanding Balance
$970,880
Interest Rate
7.08%
Mortgage Type
Purchase Money Mortgage
Estimated Equity
$4,399,103
Create a Home Valuation Report for This Property
The Home Valuation Report is an in-depth analysis detailing your home's value as well as a comparison with similar homes in the area
Home Values in the Area
Average Home Value in this Area
Purchase History
| Date | Buyer | Sale Price | Title Company |
|---|---|---|---|
| 5B Bridge St Rt | $1,680,000 | -- |
Source: Public Records
Mortgage History
| Date | Status | Borrower | Loan Amount |
|---|---|---|---|
| Open | 5B Bridge St Rt | $80,000 | |
| Open | 5B Bridge St Rt | $140,000 | |
| Open | 5B Bridge St Rt | $2,560,000 | |
| Closed | 5B Bridge St Rt | $250,000 |
Source: Public Records
Tax History Compared to Growth
Tax History
| Year | Tax Paid | Tax Assessment Tax Assessment Total Assessment is a certain percentage of the fair market value that is determined by local assessors to be the total taxable value of land and additions on the property. | Land | Improvement |
|---|---|---|---|---|
| 2025 | $41,819 | $5,169,200 | $3,690,400 | $1,478,800 |
| 2024 | $40,479 | $5,183,000 | $3,690,400 | $1,492,600 |
| 2023 | $37,768 | $4,528,500 | $3,377,800 | $1,150,700 |
| 2022 | $34,902 | $3,620,500 | $2,567,300 | $1,053,200 |
| 2021 | $34,896 | $3,326,600 | $2,435,900 | $890,700 |
| 2020 | $38,231 | $3,488,200 | $2,659,900 | $828,300 |
| 2019 | $37,189 | $3,296,900 | $2,659,900 | $637,000 |
| 2018 | $39,041 | $3,479,600 | $2,799,800 | $679,800 |
| 2017 | $37,076 | $3,445,700 | $2,799,800 | $645,900 |
| 2016 | $37,520 | $3,442,200 | $2,796,300 | $645,900 |
| 2015 | $35,964 | $3,314,700 | $2,680,300 | $634,400 |
Source: Public Records
Map
Nearby Homes
- 405 Bridge St
- 25 Oyster Way
- 71 Sand Point
- 255 Bayberry Way
- 835 Old Post Rd
- 33 Sunset Ln
- 168 Garrison Ln
- 920 Main St Unit 1 Building 2
- 920 Main St Unit 2-1
- 98 Bunker Hill Rd
- 30 Pond St
- 39 Tower Hill Rd Unit 15B
- 39 Tower Hill Rd Unit 1C
- Lot 289 Seapuit River B Rd
- 414 Eel River Rd
- Lot 288 Seapuit River A Rd
- 564 Cotuit Bay Dr
- 564 Cotuit Bay Dr
- 14 Indian Trail
- 123 Tower Hill Rd