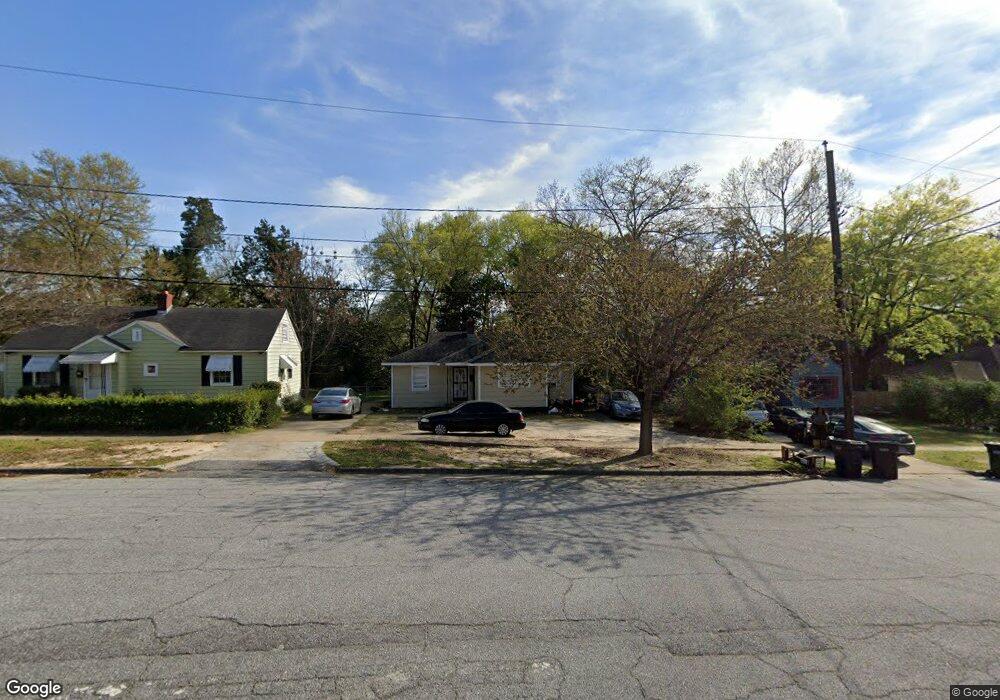
2746 Marion St Columbus, GA 31906
Briarwood NeighborhoodEstimated Value: $64,000 - $82,429
3
Beds
2
Baths
1,560
Sq Ft
$48/Sq Ft
Est. Value
About This Home
This home is located at 2746 Marion St, Columbus, GA 31906 and is currently estimated at $75,357, approximately $48 per square foot. 2746 Marion St is a home located in Muscogee County with nearby schools including Gulf Gate Elementary School, Rigdon Road Elementary School, and Rothschild Leadership Academy.
Ownership History
Date
Name
Owned For
Owner Type
Purchase Details
Closed on
Aug 20, 2024
Sold by
Woodrock Properties Llc
Bought by
Pernseb Property Group Llc
Current Estimated Value
Home Financials for this Owner
Home Financials are based on the most recent Mortgage that was taken out on this home.
Original Mortgage
$65,000
Outstanding Balance
$62,022
Interest Rate
6.07%
Mortgage Type
New Conventional
Estimated Equity
$13,335
Purchase Details
Closed on
Mar 19, 2008
Sold by
Va
Bought by
Calhoun Lawrence Hunt
Create a Home Valuation Report for This Property
The Home Valuation Report is an in-depth analysis detailing your home's value as well as a comparison with similar homes in the area
Home Values in the Area
Average Home Value in this Area
Purchase History
| Date | Buyer | Sale Price | Title Company |
|---|---|---|---|
| Pernseb Property Group Llc | $65,000 | None Listed On Document | |
| Calhoun Lawrence Hunt | -- | None Available |
Source: Public Records
Mortgage History
| Date | Status | Borrower | Loan Amount |
|---|---|---|---|
| Open | Pernseb Property Group Llc | $65,000 |
Source: Public Records
Tax History Compared to Growth
Tax History
| Year | Tax Paid | Tax Assessment Tax Assessment Total Assessment is a certain percentage of the fair market value that is determined by local assessors to be the total taxable value of land and additions on the property. | Land | Improvement |
|---|---|---|---|---|
| 2025 | $1,643 | $41,960 | $4,932 | $37,028 |
| 2024 | $731 | $18,676 | $4,932 | $13,744 |
| 2023 | $736 | $18,676 | $4,932 | $13,744 |
| 2022 | $815 | $19,952 | $4,932 | $15,020 |
| 2021 | $432 | $10,580 | $4,932 | $5,648 |
| 2020 | $432 | $10,580 | $4,932 | $5,648 |
| 2019 | $578 | $14,112 | $3,700 | $10,412 |
| 2018 | $578 | $14,112 | $3,700 | $10,412 |
| 2017 | $580 | $14,112 | $3,700 | $10,412 |
| 2016 | $952 | $23,076 | $2,210 | $20,866 |
| 2015 | $381 | $23,076 | $2,210 | $20,866 |
| 2014 | $382 | $23,076 | $2,210 | $20,866 |
| 2013 | -- | $23,076 | $2,210 | $20,866 |
Source: Public Records
Map
Nearby Homes