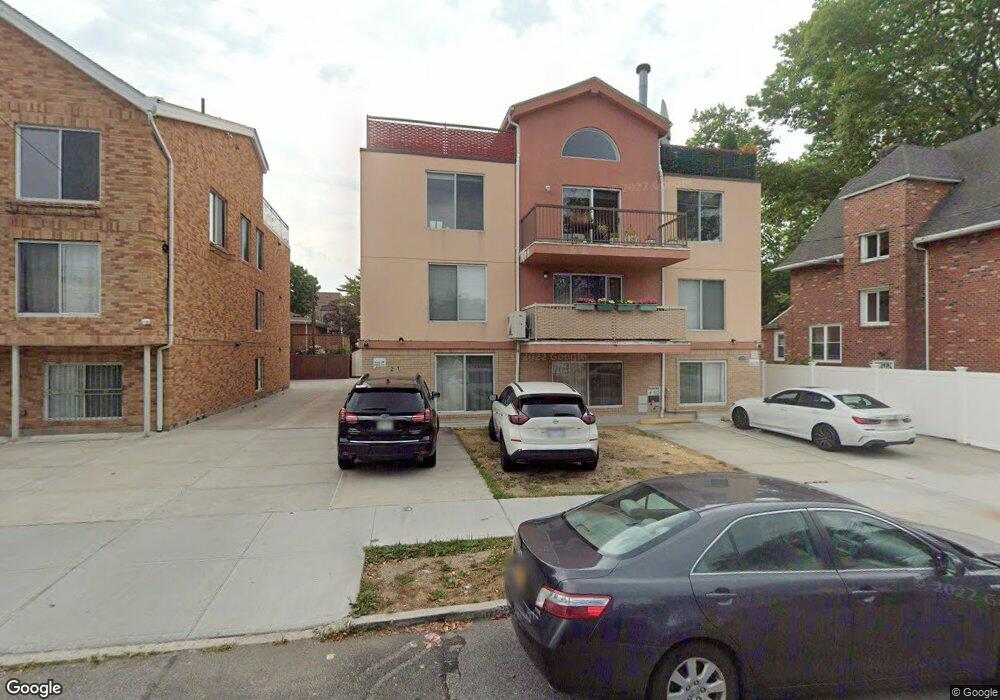
2747 E 26th St Unit 203 Brooklyn, NY 11235
Sheepshead Bay NeighborhoodEstimated Value: $421,000 - $675,000
--
Bed
--
Bath
789
Sq Ft
$683/Sq Ft
Est. Value
About This Home
This home is located at 2747 E 26th St Unit 203, Brooklyn, NY 11235 and is currently estimated at $538,989, approximately $683 per square foot. 2747 E 26th St Unit 203 is a home located in Kings County with nearby schools including P.S. 52 Sheepshead Bay, Jhs 14 Shell Bank, and New Visions Charter High School for Advanced Math/ Science.
Ownership History
Date
Name
Owned For
Owner Type
Purchase Details
Closed on
Dec 7, 2021
Sold by
Nasa Llc
Bought by
Leah Family Property Llc
Current Estimated Value
Home Financials for this Owner
Home Financials are based on the most recent Mortgage that was taken out on this home.
Original Mortgage
$250,000
Outstanding Balance
$229,965
Interest Rate
3.12%
Mortgage Type
Purchase Money Mortgage
Estimated Equity
$309,024
Purchase Details
Closed on
Oct 19, 2020
Sold by
Aans Llc
Bought by
Nasa Llc
Purchase Details
Closed on
Jul 7, 2016
Sold by
Krasnitskiy Oleg
Bought by
Aans Llc
Purchase Details
Closed on
Oct 20, 2014
Sold by
2747 East 26Th St Llc
Bought by
Krasnitskiy Oleg
Home Financials for this Owner
Home Financials are based on the most recent Mortgage that was taken out on this home.
Original Mortgage
$266,000
Interest Rate
3.97%
Create a Home Valuation Report for This Property
The Home Valuation Report is an in-depth analysis detailing your home's value as well as a comparison with similar homes in the area
Home Values in the Area
Average Home Value in this Area
Purchase History
| Date | Buyer | Sale Price | Title Company |
|---|---|---|---|
| Leah Family Property Llc | $400,000 | -- | |
| Nasa Llc | -- | -- | |
| Aans Llc | -- | -- | |
| Krasnitskiy Oleg | $200,000 | -- |
Source: Public Records
Mortgage History
| Date | Status | Borrower | Loan Amount |
|---|---|---|---|
| Open | Leah Family Property Llc | $250,000 | |
| Previous Owner | Krasnitskiy Oleg | $266,000 |
Source: Public Records
Tax History Compared to Growth
Tax History
| Year | Tax Paid | Tax Assessment Tax Assessment Total Assessment is a certain percentage of the fair market value that is determined by local assessors to be the total taxable value of land and additions on the property. | Land | Improvement |
|---|---|---|---|---|
| 2025 | $426 | $28,959 | $6,046 | $22,913 |
| 2024 | $426 | $28,549 | $6,046 | $22,503 |
| 2023 | $430 | $28,845 | $6,046 | $22,799 |
| 2022 | $423 | $26,594 | $6,046 | $20,548 |
| 2021 | $446 | $23,195 | $6,046 | $17,149 |
| 2020 | $222 | $23,026 | $6,046 | $16,980 |
| 2019 | $443 | $20,022 | $6,046 | $13,976 |
| 2018 | $432 | $18,034 | $4,867 | $13,167 |
| 2017 | $432 | $17,898 | $5,214 | $12,684 |
| 2016 | $424 | $16,885 | $5,462 | $11,423 |
| 2015 | -- | $15,930 | $5,429 | $10,501 |
| 2014 | -- | $15,029 | $6,148 | $8,881 |
Source: Public Records
Map
Nearby Homes
- 4715 Bedford Ave
- 2711 E 26th St
- 4709 Bedford Ave
- 2614 Voorhies Ave
- 2726 E 27th St
- 2758 E 26th St
- 2752 E 27th St Unit A3
- 3611 Shore Pkwy Unit 1C
- 2330 Voorhies Ave Unit LC
- 2330 Voorhies Ave Unit 1
- 2330 Voorhies Ave Unit 1C
- 2679 E 24th St Unit 1B
- 4665 Bedford Ave Unit 3B
- 2703 E 28th St
- 2628 E 26th St Unit 201S
- 2643 E 24th St Unit 3A
- 4648 Bedford Ave
- 4641 Bedford Ave Unit 2B
- 4817 Bedford Ave Unit 3A
- 2613 Emmons Ave Unit 3D
- 2747 E 26th St
- 2747 E 26th St Unit 102
- 2747 E 26th St Unit 301
- 2747 E 26th St Unit SR2
- 2747 E 26th St Unit SR5
- 2747 E 26th St Unit 201
- 2747 E 26th St Unit PS1
- 2747 E 26th St Unit 101
- 2747 E 26th St Unit PS6
- 2747 E 26th St Unit PS3
- 2747 E 26th St Unit SR3
- 2747 E 26th St Unit SR4
- 2747 E 26th St Unit 202
- 2747 E 26th St Unit 302
- 2747 E 26th St Unit SR1
- 2747 E 26th St Unit PS2
- 2747 E 26th St Unit PS7
- 2747 E 26th St Unit PS5
- 2747 E 26th St Unit PS4
- 2755 E 26th St