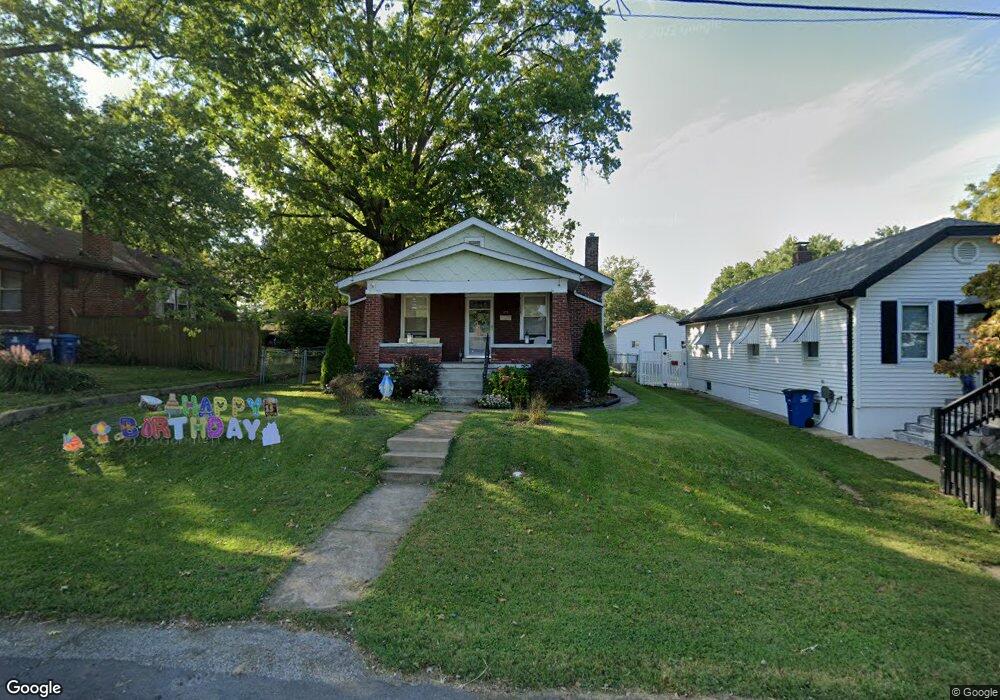
275 Pardella Ave Saint Louis, MO 63125
Lemay NeighborhoodEstimated Value: $151,000 - $174,000
2
Beds
1
Bath
1,064
Sq Ft
$154/Sq Ft
Est. Value
About This Home
This home is located at 275 Pardella Ave, Saint Louis, MO 63125 and is currently estimated at $163,872, approximately $154 per square foot. 275 Pardella Ave is a home located in St. Louis County with nearby schools including Hancock Place Elementary School, Hancock Place Middle School, and Hancock Place High School.
Ownership History
Date
Name
Owned For
Owner Type
Purchase Details
Closed on
Aug 23, 2012
Sold by
Hackmann Eric L and Hackmann Jennifer L
Bought by
Hackmann Eric L and Hackmann Jennifer L
Current Estimated Value
Home Financials for this Owner
Home Financials are based on the most recent Mortgage that was taken out on this home.
Original Mortgage
$86,487
Outstanding Balance
$13,783
Interest Rate
3.56%
Mortgage Type
FHA
Estimated Equity
$150,089
Purchase Details
Closed on
Mar 23, 2001
Sold by
Utts Steven M and Utts Tammy L
Bought by
Kenney Jennifer L
Home Financials for this Owner
Home Financials are based on the most recent Mortgage that was taken out on this home.
Original Mortgage
$71,150
Interest Rate
6.98%
Purchase Details
Closed on
Dec 15, 1998
Sold by
Schmans Horace F and Schmans Lena M
Bought by
Utts Steven M and Utts Tammy L
Home Financials for this Owner
Home Financials are based on the most recent Mortgage that was taken out on this home.
Original Mortgage
$62,000
Interest Rate
6.92%
Mortgage Type
FHA
Purchase Details
Closed on
Dec 17, 1997
Sold by
Muriel Meine
Bought by
Schmans Horace F and Schmans Lena M
Create a Home Valuation Report for This Property
The Home Valuation Report is an in-depth analysis detailing your home's value as well as a comparison with similar homes in the area
Home Values in the Area
Average Home Value in this Area
Purchase History
| Date | Buyer | Sale Price | Title Company |
|---|---|---|---|
| Hackmann Eric L | -- | Touchstone | |
| Kenney Jennifer L | $74,900 | -- | |
| Kenney Jennifer L | -- | -- | |
| Utts Steven M | $61,500 | -- | |
| Schmans Horace F | -- | -- |
Source: Public Records
Mortgage History
| Date | Status | Borrower | Loan Amount |
|---|---|---|---|
| Open | Hackmann Eric L | $86,487 | |
| Closed | Kenney Jennifer L | $71,150 | |
| Previous Owner | Utts Steven M | $62,000 |
Source: Public Records
Tax History Compared to Growth
Tax History
| Year | Tax Paid | Tax Assessment Tax Assessment Total Assessment is a certain percentage of the fair market value that is determined by local assessors to be the total taxable value of land and additions on the property. | Land | Improvement |
|---|---|---|---|---|
| 2025 | $2,237 | $32,660 | $12,730 | $19,930 |
| 2024 | $2,237 | $28,880 | $5,090 | $23,790 |
| 2023 | $2,125 | $28,880 | $5,090 | $23,790 |
| 2022 | $1,921 | $23,640 | $5,870 | $17,770 |
| 2021 | $1,888 | $23,640 | $5,870 | $17,770 |
| 2020 | $1,634 | $19,500 | $5,800 | $13,700 |
| 2019 | $1,629 | $19,500 | $5,800 | $13,700 |
| 2018 | $1,494 | $15,570 | $4,470 | $11,100 |
| 2017 | $1,468 | $15,570 | $4,470 | $11,100 |
| 2016 | $1,243 | $12,660 | $2,000 | $10,660 |
| 2015 | $1,236 | $12,660 | $2,000 | $10,660 |
| 2014 | $1,387 | $15,140 | $3,990 | $11,150 |
Source: Public Records
Map
Nearby Homes
- 622 Kayser Ave
- 610 Kayser Ave
- 8626 Shoss Ave
- 514 E Dallas Ct
- 252 Wachtel Ave
- 712 Pardella Ave
- 241 Dammert Ave
- 711 Erskine Ave
- 715 Erskine Ave
- 235 Military Rd
- 720 Erskine Ave
- 300 Kayser Ave
- 8523 Idaho Ave
- 8439 Tennessee Ave
- 302 Waller Ave
- 765 Pardella Ave Unit A
- 335 Horn Ave
- 522 Lagro Ave
- 437 Hoffmeister Ave
- 3708 Comstock Dr
- 279 Pardella Ave
- 271 Pardella Ave
- 263 Pardella Ave
- 248 Baumann Ave
- 250 Baumann Ave
- 246 Baumann Ave
- 264 Baumann Ave
- 244 Baumann Ave
- 274 Pardella Ave
- 270 Pardella Ave
- 242 Baumann Ave
- 266 Pardella Ave
- 3704 Fannie Ave
- 3706 Fannie Ave
- 278 Pardella Ave
- 3700 Fannie Ave
- 259 Pardella Ave
- 3708 Fannie Ave
- 264 Pardella Ave
- 3710 Fannie Ave