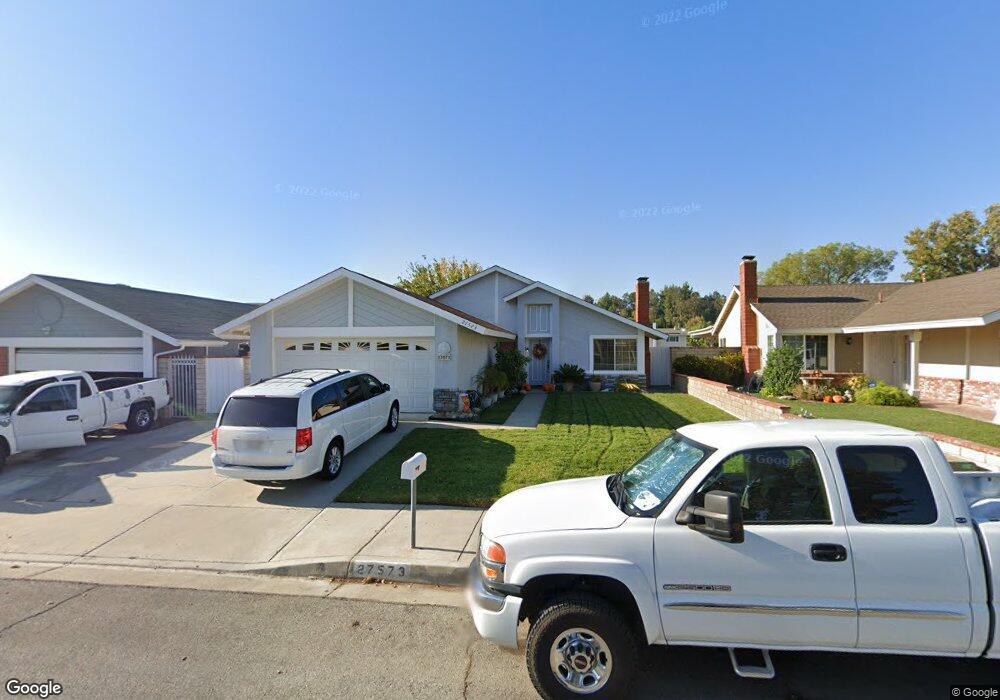
27573 Falling Star Ln Santa Clarita, CA 91350
Saugus NeighborhoodEstimated Value: $745,232 - $795,000
4
Beds
2
Baths
1,400
Sq Ft
$552/Sq Ft
Est. Value
About This Home
This home is located at 27573 Falling Star Ln, Santa Clarita, CA 91350 and is currently estimated at $772,808, approximately $552 per square foot. 27573 Falling Star Ln is a home located in Los Angeles County with nearby schools including Highlands Elementary School, Arroyo Seco Junior High School, and Saugus High School.
Ownership History
Date
Name
Owned For
Owner Type
Purchase Details
Closed on
Dec 14, 2005
Sold by
Garcia John Jay
Bought by
Garcia John Jay and Garcia Virginia
Current Estimated Value
Purchase Details
Closed on
Jan 6, 2003
Sold by
Ramieri Joseph M
Bought by
Ramieri Joseph M and Ramieri Jeanette
Home Financials for this Owner
Home Financials are based on the most recent Mortgage that was taken out on this home.
Original Mortgage
$236,385
Outstanding Balance
$101,138
Interest Rate
6.06%
Estimated Equity
$671,670
Purchase Details
Closed on
Jun 22, 2000
Sold by
Howard Willard M
Bought by
Ramieri Joseph M
Home Financials for this Owner
Home Financials are based on the most recent Mortgage that was taken out on this home.
Original Mortgage
$208,900
Interest Rate
8.2%
Purchase Details
Closed on
Nov 8, 1994
Sold by
Mullen Thomas Allen
Bought by
Howard Willard M and Howard Kimberly T
Home Financials for this Owner
Home Financials are based on the most recent Mortgage that was taken out on this home.
Original Mortgage
$134,400
Interest Rate
8.92%
Create a Home Valuation Report for This Property
The Home Valuation Report is an in-depth analysis detailing your home's value as well as a comparison with similar homes in the area
Home Values in the Area
Average Home Value in this Area
Purchase History
| Date | Buyer | Sale Price | Title Company |
|---|---|---|---|
| Garcia John Jay | -- | None Available | |
| Ramieri Joseph M | -- | Placer Title Company | |
| Ramieri Joseph M | $220,000 | Southland Title | |
| Howard Willard M | $168,000 | Old Republic Title Company |
Source: Public Records
Mortgage History
| Date | Status | Borrower | Loan Amount |
|---|---|---|---|
| Open | Ramieri Joseph M | $236,385 | |
| Closed | Ramieri Joseph M | $208,900 | |
| Previous Owner | Howard Willard M | $134,400 |
Source: Public Records
Tax History Compared to Growth
Tax History
| Year | Tax Paid | Tax Assessment Tax Assessment Total Assessment is a certain percentage of the fair market value that is determined by local assessors to be the total taxable value of land and additions on the property. | Land | Improvement |
|---|---|---|---|---|
| 2025 | $4,793 | $331,330 | $175,685 | $155,645 |
| 2024 | $4,793 | $324,835 | $172,241 | $152,594 |
| 2023 | $4,648 | $318,466 | $168,864 | $149,602 |
| 2022 | $4,665 | $312,222 | $165,553 | $146,669 |
| 2021 | $4,586 | $306,101 | $162,307 | $143,794 |
| 2019 | $4,426 | $297,024 | $157,494 | $139,530 |
| 2018 | $4,292 | $291,201 | $154,406 | $136,795 |
| 2016 | $4,046 | $279,895 | $148,411 | $131,484 |
| 2015 | $3,895 | $275,691 | $146,182 | $129,509 |
| 2014 | $3,833 | $270,292 | $143,319 | $126,973 |
Source: Public Records
Map
Nearby Homes
- 21560 Quinn Place
- 27547 Saffron Ln
- 21827 Centurion Way
- 21643 Masterson Ct
- 27502 Caraway Ln
- 27620 Susan Beth Way Unit A
- 21929 Peppercorn Dr
- 21983 Centurion Way
- 27610 Kevin Place
- 27641 Sutters Pointe Dr
- 22003 Caceras St
- 21123 Avenida de Sonrisa
- 28050 Devon Ln
- 28123 Bobwhite Cir Unit 104
- 27619 Ron Ridge Dr
- 27215 Elias Ave
- 21741 Jeffers Ln
- 27828 Parkvale Dr
- 27231 Cabrera Ave
- 20906 Susan Carole Dr
- 27579 Falling Star Ln
- 27569 Falling Star Ln
- 27565 Falling Star Ln
- 27585 Falling Star Ln
- 27559 Falling Star Ln
- 27589 Falling Star Ln
- 27570 Falling Star Ln
- 27574 Falling Star Ln
- 27566 Falling Star Ln
- 27580 Falling Star Ln
- 27553 Falling Star Ln
- 27560 Falling Star Ln
- 27593 Falling Star Ln
- 27586 Falling Star Ln
- 27554 Falling Star Ln
- 27549 Falling Star Ln
- 27616 Caraway Ln
- 27608 Caraway Ln
- 27597 Falling Star Ln
- 27622 Caraway Ln