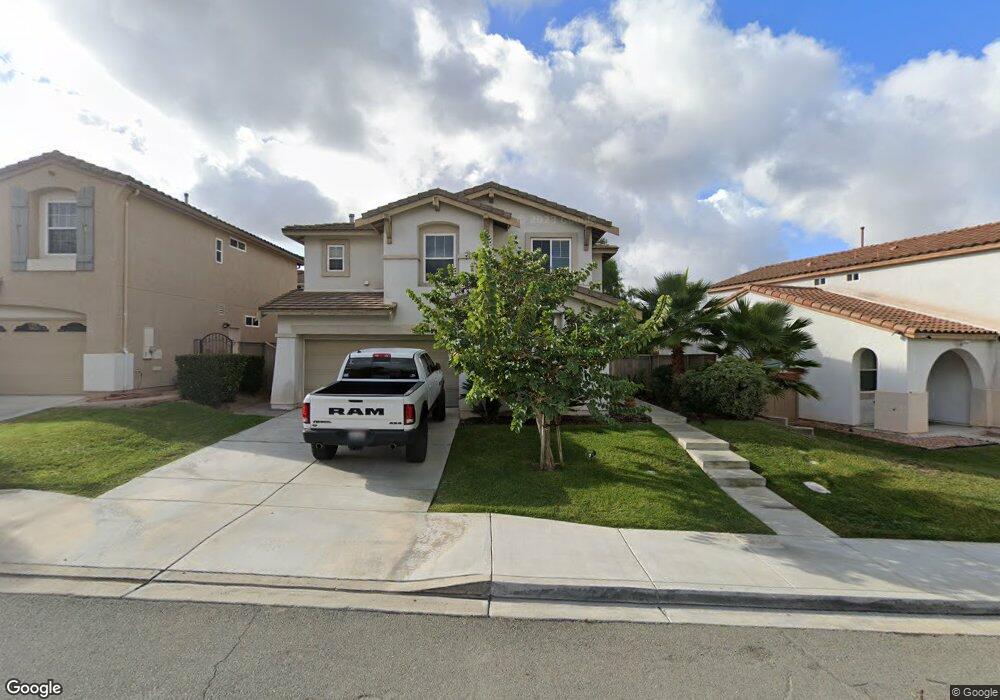
2778 Red Rock Canyon Rd Chula Vista, CA 91915
Eastlake NeighborhoodEstimated Value: $941,000 - $982,000
4
Beds
3
Baths
2,014
Sq Ft
$479/Sq Ft
Est. Value
About This Home
This home is located at 2778 Red Rock Canyon Rd, Chula Vista, CA 91915 and is currently estimated at $963,726, approximately $478 per square foot. 2778 Red Rock Canyon Rd is a home located in San Diego County with nearby schools including Salt Creek Elementary School, Eastlake Middle School, and Eastlake High School.
Ownership History
Date
Name
Owned For
Owner Type
Purchase Details
Closed on
Mar 27, 2012
Sold by
Pnc Bank National Association
Bought by
Pferdekamper Jack M
Current Estimated Value
Home Financials for this Owner
Home Financials are based on the most recent Mortgage that was taken out on this home.
Original Mortgage
$326,507
Outstanding Balance
$224,989
Interest Rate
3.86%
Mortgage Type
FHA
Estimated Equity
$738,737
Purchase Details
Closed on
Nov 10, 2011
Sold by
Esparza Sergio and Esparza Alejandrina
Bought by
Pnc Bank National Association
Purchase Details
Closed on
Nov 23, 2004
Sold by
Monticello At Eastlake Lp
Bought by
Esparza Sergio and Esparza Alejandrina
Home Financials for this Owner
Home Financials are based on the most recent Mortgage that was taken out on this home.
Original Mortgage
$483,600
Interest Rate
5.5%
Mortgage Type
Unknown
Create a Home Valuation Report for This Property
The Home Valuation Report is an in-depth analysis detailing your home's value as well as a comparison with similar homes in the area
Home Values in the Area
Average Home Value in this Area
Purchase History
| Date | Buyer | Sale Price | Title Company |
|---|---|---|---|
| Pferdekamper Jack M | $335,000 | Service Link | |
| Pnc Bank National Association | $544,269 | Accommodation | |
| Esparza Sergio | $605,000 | First American Title |
Source: Public Records
Mortgage History
| Date | Status | Borrower | Loan Amount |
|---|---|---|---|
| Open | Pferdekamper Jack M | $326,507 | |
| Previous Owner | Esparza Sergio | $483,600 |
Source: Public Records
Tax History Compared to Growth
Tax History
| Year | Tax Paid | Tax Assessment Tax Assessment Total Assessment is a certain percentage of the fair market value that is determined by local assessors to be the total taxable value of land and additions on the property. | Land | Improvement |
|---|---|---|---|---|
| 2025 | $7,211 | $420,764 | $237,265 | $183,499 |
| 2024 | $7,211 | $412,514 | $232,613 | $179,901 |
| 2023 | $7,193 | $404,426 | $228,052 | $176,374 |
| 2022 | $6,998 | $396,497 | $223,581 | $172,916 |
| 2021 | $6,856 | $388,724 | $219,198 | $169,526 |
| 2020 | $6,711 | $384,739 | $216,951 | $167,788 |
| 2019 | $6,560 | $377,197 | $212,698 | $164,499 |
| 2018 | $6,464 | $369,802 | $208,528 | $161,274 |
| 2017 | $13 | $362,552 | $204,440 | $158,112 |
| 2016 | $6,134 | $355,444 | $200,432 | $155,012 |
| 2015 | $6,015 | $350,106 | $197,422 | $152,684 |
| 2014 | $5,965 | $343,249 | $193,555 | $149,694 |
Source: Public Records
Map
Nearby Homes
- 1427 Marble Canyon Way
- 2744 Rambling Vista Rd
- 1436 Horn Canyon Ave
- 2792 Rambling Vista Rd
- 2814 Rambling Vista Rd
- 1461 Agate Creek Way
- 2832 Echo Ridge Ct
- 1505 Laurel Grove Dr Unit 3
- 2796 Bear Valley Rd
- 2721 Castlehill Rd Unit 1
- 1328 N Paradise Ridge Way
- 2816 Weeping Willow Rd
- 2754 Silver Medal Rd Unit 1
- 2850 Palmetto Point Ct
- 2993 Weeping Willow Rd
- 2710 Sparta Rd Unit 10
- 1515 Crown Ln Unit 6
- 2710 Apricot Ct
- 1512 Champion Ln Unit 4
- 2770 Sparta Rd Unit 14
- 2772 Red Rock Canyon Rd
- 2782 Red Rock Canyon Rd
- 1414 Blackstone Ave
- 2768 Red Rock Canyon Rd
- 1411 Yellowstone Ave
- 1418 Blackstone Ave
- 1415 Yellowstone Ave
- 2779 Red Rock Canyon Rd
- 2775 Red Rock Canyon Rd
- 2783 Red Rock Canyon Rd
- 2760 Red Rock Canyon Rd
- 2771 Red Rock Canyon Rd
- 1419 Yellowstone Ave
- 2792 Red Rock Canyon Rd
- 1422 Blackstone Ave
- 2787 Red Rock Canyon Rd
- 2767 Red Rock Canyon Rd
- 1423 Yellowstone Ave
- 2763 Red Rock Canyon Rd
- 2791 Red Rock Canyon Rd