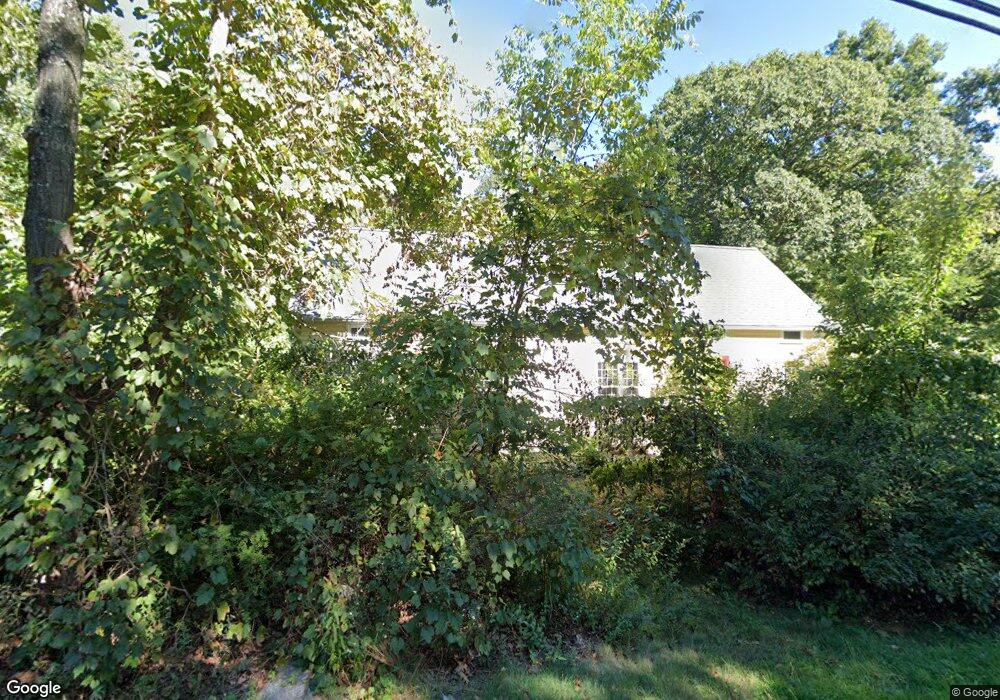
278 Flanders Rd Woodbury, CT 06798
Estimated Value: $558,838 - $672,000
4
Beds
2
Baths
2,112
Sq Ft
$289/Sq Ft
Est. Value
About This Home
This home is located at 278 Flanders Rd, Woodbury, CT 06798 and is currently estimated at $609,460, approximately $288 per square foot. 278 Flanders Rd is a home located in Litchfield County with nearby schools including Mitchell Elementary School, Bethlehem Elementary School, and Woodbury Middle School.
Ownership History
Date
Name
Owned For
Owner Type
Purchase Details
Closed on
Nov 14, 2011
Sold by
Bove James and Bove Georgia
Bought by
Glickman Randall and Glickman Mary
Current Estimated Value
Home Financials for this Owner
Home Financials are based on the most recent Mortgage that was taken out on this home.
Original Mortgage
$253,600
Outstanding Balance
$172,847
Interest Rate
4.01%
Estimated Equity
$436,613
Purchase Details
Closed on
Jul 25, 1997
Sold by
Pritchard Kenlynne
Bought by
Bove James and Bove Georgia
Home Financials for this Owner
Home Financials are based on the most recent Mortgage that was taken out on this home.
Original Mortgage
$200,000
Interest Rate
7.7%
Mortgage Type
Unknown
Purchase Details
Closed on
Feb 22, 1989
Sold by
Blair Russel J
Bought by
Prichard Ken Lynne W
Create a Home Valuation Report for This Property
The Home Valuation Report is an in-depth analysis detailing your home's value as well as a comparison with similar homes in the area
Home Values in the Area
Average Home Value in this Area
Purchase History
| Date | Buyer | Sale Price | Title Company |
|---|---|---|---|
| Glickman Randall | $317,000 | -- | |
| Bove James | $232,000 | -- | |
| Prichard Ken Lynne W | $245,000 | -- |
Source: Public Records
Mortgage History
| Date | Status | Borrower | Loan Amount |
|---|---|---|---|
| Open | Prichard Ken Lynne W | $45,800 | |
| Open | Prichard Ken Lynne W | $253,600 | |
| Previous Owner | Prichard Ken Lynne W | $189,000 | |
| Previous Owner | Prichard Ken Lynne W | $200,000 |
Source: Public Records
Tax History Compared to Growth
Tax History
| Year | Tax Paid | Tax Assessment Tax Assessment Total Assessment is a certain percentage of the fair market value that is determined by local assessors to be the total taxable value of land and additions on the property. | Land | Improvement |
|---|---|---|---|---|
| 2025 | $6,215 | $263,130 | $73,640 | $189,490 |
| 2024 | $6,097 | $263,130 | $73,640 | $189,490 |
| 2023 | $5,786 | $199,100 | $73,600 | $125,500 |
| 2022 | $5,808 | $199,100 | $73,600 | $125,500 |
| 2021 | $5,808 | $199,100 | $73,600 | $125,500 |
| 2020 | $5,808 | $199,100 | $73,600 | $125,500 |
| 2019 | $5,808 | $199,100 | $73,600 | $125,500 |
| 2018 | $5,846 | $219,950 | $90,000 | $129,950 |
| 2017 | $5,974 | $219,950 | $90,000 | $129,950 |
| 2016 | $5,782 | $219,950 | $90,000 | $129,950 |
| 2015 | $5,734 | $219,950 | $90,000 | $129,950 |
| 2014 | $5,651 | $219,950 | $90,000 | $129,950 |
Source: Public Records
Map
Nearby Homes
- 101 Plumb Brook Rd
- 148 Flanders Rd
- 819 Main St N
- 509 Main St N
- 523 Main St N
- 18 Woodbury Hill
- 105 Minortown Rd
- 38 Barnhill Rd
- 174 Weekeepeemee Rd
- 92 Minortown Rd
- 94 Old Town Farm Rd
- 45 N Gate Rd
- 0 Cowles Rd
- 43 Hoop Pole Hill Rd
- 439 Washington Rd
- 329 Weekeepeemee Rd
- 393 Middle Road Turnpike
- 437 Middle Road Turnpike
- 74 Washington Rd Unit 16
- 2 Linden Rd
- 288 Flanders Rd
- 2 Old Flanders Rd
- 266 Flanders Rd
- 307 Flanders Rd
- 250 Flanders Rd
- 23 Plumb Brook Rd
- 258 Flanders Rd
- 30 Old Flanders Rd
- 241 Flanders Rd
- 37 Plumb Brook Rd
- 34 Old Flanders Rd
- 15 Old Flanders Rd
- 56 Plumb Brook Rd
- 25 Old Flanders Rd
- 49 Plumb Brook Rd
- 42 Old Flanders Rd
- 35 Old Flanders Rd
- 222 Flanders Rd
- 234 Flanders Rd
- 53 Plumb Brook Rd