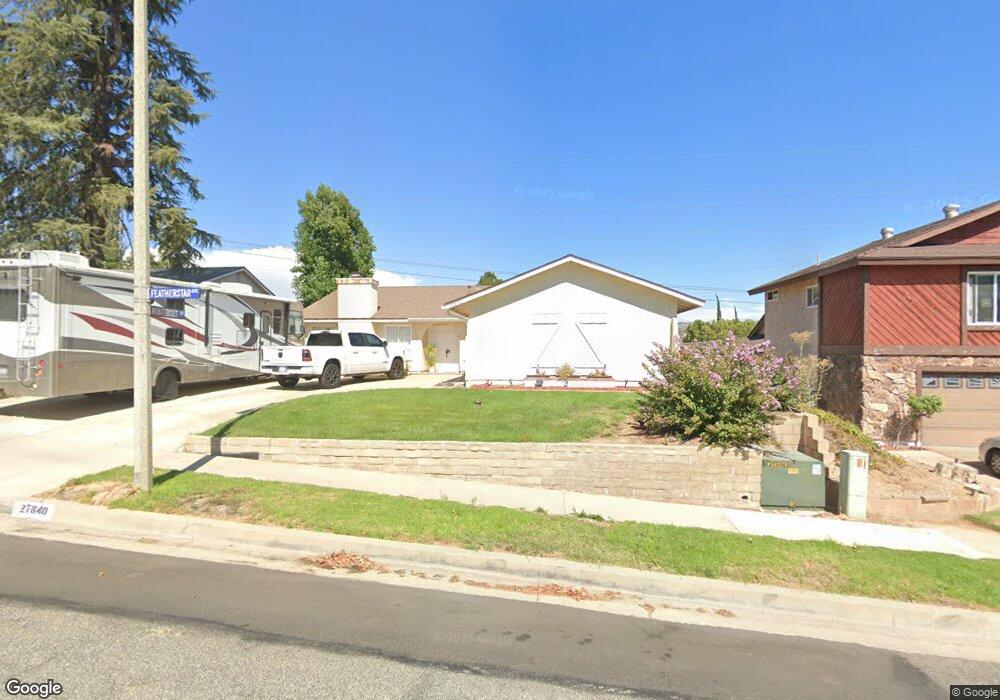
27840 Featherstar Ave Santa Clarita, CA 91350
Saugus NeighborhoodEstimated Value: $798,000 - $822,371
4
Beds
2
Baths
1,650
Sq Ft
$493/Sq Ft
Est. Value
About This Home
This home is located at 27840 Featherstar Ave, Santa Clarita, CA 91350 and is currently estimated at $813,343, approximately $492 per square foot. 27840 Featherstar Ave is a home located in Los Angeles County with nearby schools including Rosedell Elementary School, Arroyo Seco Junior High School, and Saugus High School.
Ownership History
Date
Name
Owned For
Owner Type
Purchase Details
Closed on
Jul 19, 2019
Sold by
Pennington Daniel E
Bought by
Pennington Daniel Earl and Daniel Pennington Living Trust
Current Estimated Value
Purchase Details
Closed on
Feb 4, 2010
Sold by
Goodrich Adria and Goodrich Lea D
Bought by
Pennington Daniel E
Home Financials for this Owner
Home Financials are based on the most recent Mortgage that was taken out on this home.
Original Mortgage
$338,751
Outstanding Balance
$229,404
Interest Rate
5.5%
Mortgage Type
FHA
Estimated Equity
$583,939
Purchase Details
Closed on
Feb 9, 2005
Sold by
Goodrich Lea D and Goodrich Adria
Bought by
Goodrich Lea D
Purchase Details
Closed on
Oct 13, 1995
Sold by
Goodrich Lea D and Goodrich Adria
Bought by
Goodrich Lea D
Home Financials for this Owner
Home Financials are based on the most recent Mortgage that was taken out on this home.
Original Mortgage
$149,853
Interest Rate
7.59%
Mortgage Type
FHA
Create a Home Valuation Report for This Property
The Home Valuation Report is an in-depth analysis detailing your home's value as well as a comparison with similar homes in the area
Home Values in the Area
Average Home Value in this Area
Purchase History
| Date | Buyer | Sale Price | Title Company |
|---|---|---|---|
| Pennington Daniel Earl | -- | None Available | |
| Pennington Daniel E | $345,000 | California Counties Title Co | |
| Goodrich Lea D | -- | -- | |
| Goodrich Lea D | -- | Fidelity National Title Ins |
Source: Public Records
Mortgage History
| Date | Status | Borrower | Loan Amount |
|---|---|---|---|
| Open | Pennington Daniel E | $338,751 | |
| Previous Owner | Goodrich Lea D | $149,853 |
Source: Public Records
Tax History Compared to Growth
Tax History
| Year | Tax Paid | Tax Assessment Tax Assessment Total Assessment is a certain percentage of the fair market value that is determined by local assessors to be the total taxable value of land and additions on the property. | Land | Improvement |
|---|---|---|---|---|
| 2025 | $6,179 | $445,314 | $247,182 | $198,132 |
| 2024 | $6,179 | $436,584 | $242,336 | $194,248 |
| 2023 | $6,008 | $428,025 | $237,585 | $190,440 |
| 2022 | $6,034 | $419,633 | $232,927 | $186,706 |
| 2021 | $5,932 | $411,406 | $228,360 | $183,046 |
| 2019 | $5,720 | $399,206 | $221,588 | $177,618 |
| 2018 | $5,566 | $391,380 | $217,244 | $174,136 |
| 2016 | $5,257 | $376,184 | $208,809 | $167,375 |
| 2015 | $5,062 | $370,534 | $205,673 | $164,861 |
| 2014 | $4,984 | $363,277 | $201,645 | $161,632 |
Source: Public Records
Map
Nearby Homes
- 21560 Quinn Place
- 21643 Masterson Ct
- 28123 Bobwhite Cir Unit 104
- 27620 Susan Beth Way Unit A
- 21123 Avenida de Sonrisa
- 28050 Devon Ln
- 27828 Parkvale Dr
- 21741 Jeffers Ln
- 21929 Peppercorn Dr
- 27641 Sutters Pointe Dr
- 20906 Susan Carole Dr
- 27547 Saffron Ln
- 21827 Centurion Way
- 21983 Centurion Way
- 27502 Caraway Ln
- 27610 Kevin Place
- 28303 Sycamore Dr
- 28340 Sycamore Dr
- 28016 Robin Ave
- 28011 Charles Dr
- 27848 Featherstar Ave
- 27834 Featherstar Ave
- 27826 Featherstar Ave
- 27854 Featherstar Ave
- 21501 Winterset Dr
- 21500 Winterset Dr
- 27816 Featherstar Ave
- 27904 Featherstar Ave
- 27823 Featherstar Ave
- 21509 Winterset Dr
- 27857 Featherstar Ave
- 21510 Winterset Dr
- 27800 Featherstar Ave
- 27910 Featherstar Ave
- 21515 Winterset Dr
- 27815 Featherstar Ave
- 27907 Featherstar Ave
- 27809 Featherstar Ave
- 27920 Featherstar Ave
- 27915 Featherstar Ave