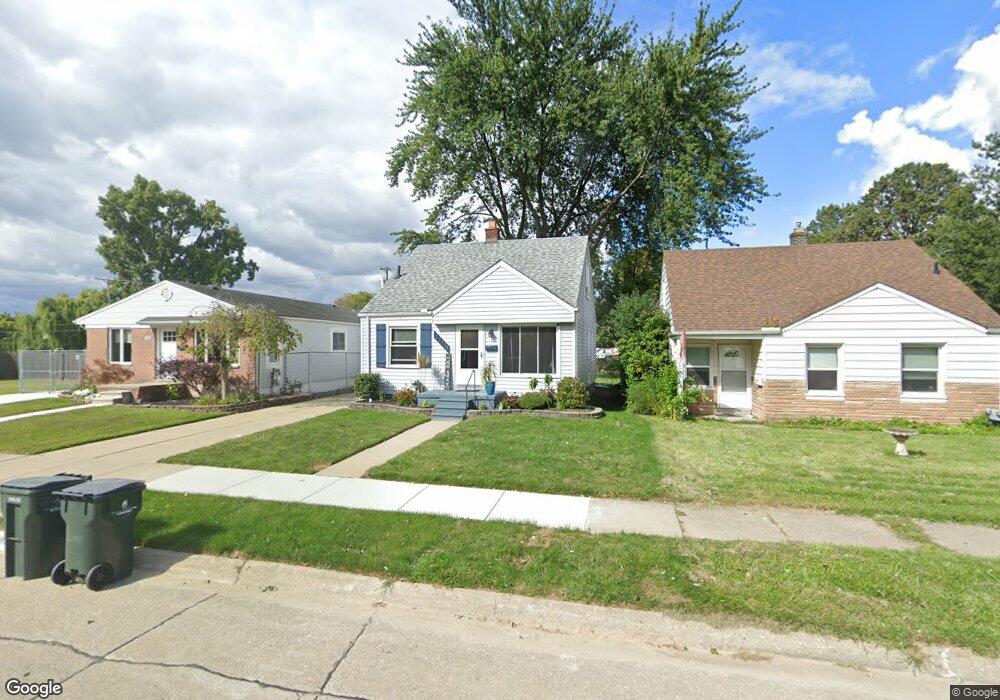
27935 Larchmont St Saint Clair Shores, MI 48081
Estimated Value: $204,000 - $224,000
3
Beds
1
Bath
992
Sq Ft
$212/Sq Ft
Est. Value
About This Home
This home is located at 27935 Larchmont St, Saint Clair Shores, MI 48081 and is currently estimated at $210,727, approximately $212 per square foot. 27935 Larchmont St is a home located in Macomb County with nearby schools including Lakeview High School and St. Germaine Catholic School.
Ownership History
Date
Name
Owned For
Owner Type
Purchase Details
Closed on
May 15, 2021
Sold by
Samac Richard A and Lucido Heather A
Bought by
Samac Richard A
Current Estimated Value
Purchase Details
Closed on
Aug 14, 2020
Sold by
Samac Richard A
Bought by
Samac Richard A and Lucido Heather A
Home Financials for this Owner
Home Financials are based on the most recent Mortgage that was taken out on this home.
Original Mortgage
$127,645
Interest Rate
2.9%
Mortgage Type
FHA
Purchase Details
Closed on
Jan 30, 2008
Sold by
Boron Sarah Beth and Whitton Sarah Beth
Bought by
Boron Joshua Michael
Purchase Details
Closed on
Apr 9, 2004
Sold by
Markley Richard D and Markley Michelle M
Bought by
Boron Joshua
Home Financials for this Owner
Home Financials are based on the most recent Mortgage that was taken out on this home.
Original Mortgage
$141,338
Interest Rate
5.5%
Mortgage Type
FHA
Purchase Details
Closed on
Jul 14, 1998
Sold by
Hazlett Diane C
Bought by
Markley Richard D
Create a Home Valuation Report for This Property
The Home Valuation Report is an in-depth analysis detailing your home's value as well as a comparison with similar homes in the area
Home Values in the Area
Average Home Value in this Area
Purchase History
| Date | Buyer | Sale Price | Title Company |
|---|---|---|---|
| Samac Richard A | -- | None Listed On Document | |
| Samac Richard A | -- | None Available | |
| Samac Richard A | $130,000 | Fmt | |
| Boron Joshua Michael | -- | None Available | |
| Boron Joshua | $142,500 | -- | |
| Markley Richard D | $112,500 | -- |
Source: Public Records
Mortgage History
| Date | Status | Borrower | Loan Amount |
|---|---|---|---|
| Previous Owner | Samac Richard A | $127,645 | |
| Previous Owner | Boron Joshua | $141,338 |
Source: Public Records
Tax History Compared to Growth
Tax History
| Year | Tax Paid | Tax Assessment Tax Assessment Total Assessment is a certain percentage of the fair market value that is determined by local assessors to be the total taxable value of land and additions on the property. | Land | Improvement |
|---|---|---|---|---|
| 2025 | $3,497 | $86,400 | $0 | $0 |
| 2024 | $3,387 | $82,300 | $0 | $0 |
| 2023 | $3,303 | $72,900 | $0 | $0 |
| 2022 | $3,232 | $67,400 | $0 | $0 |
| 2021 | $3,172 | $63,500 | $0 | $0 |
| 2020 | $2,506 | $59,900 | $0 | $0 |
| 2019 | $2,421 | $51,700 | $0 | $0 |
| 2018 | $2,378 | $46,400 | $0 | $0 |
| 2017 | $2,300 | $45,000 | $4,200 | $40,800 |
| 2016 | $2,140 | $45,000 | $0 | $0 |
| 2015 | $1,520 | $40,700 | $0 | $0 |
| 2012 | -- | $33,100 | $5,000 | $28,100 |
Source: Public Records
Map
Nearby Homes
- 27728 Larchmont St
- 28107 Ursuline St
- 19423 Hazelwood St
- 20101 Meier Rd
- 27727 Joan St
- 20221 E 11 Mile Rd
- 28131 Elmdale St
- 0 Lasslett St
- 27719 Rockwood St
- 26828 Waldorf St
- 19791 Martin Rd Unit 11
- 27734 Lasslett St
- 20400 Martin Rd
- 26815 Waldorf St
- 27226 Lawnwood St
- 27318 Grant St
- 26561 Barnes St
- 26842 Pattow St
- 27336 Ridgewood St
- 26604 Normandy St
- 27931 Larchmont St
- 27941 Larchmont St
- 27940 Hughes St
- 27921 Larchmont St
- 27934 Larchmont St
- 27930 Larchmont St
- 27940 Larchmont St
- 27911 Larchmont St
- 28005 Larchmont St
- 27920 Larchmont St Unit Bldg-Unit
- 27920 Larchmont St
- 28000 Hughes St
- 27907 Larchmont St
- 28000 Larchmont St
- 28004 Hughes St
- 28011 Larchmont St
- 27910 Larchmont St
- 28004 Larchmont St
- 27935 Grant St
- 27939 Grant St