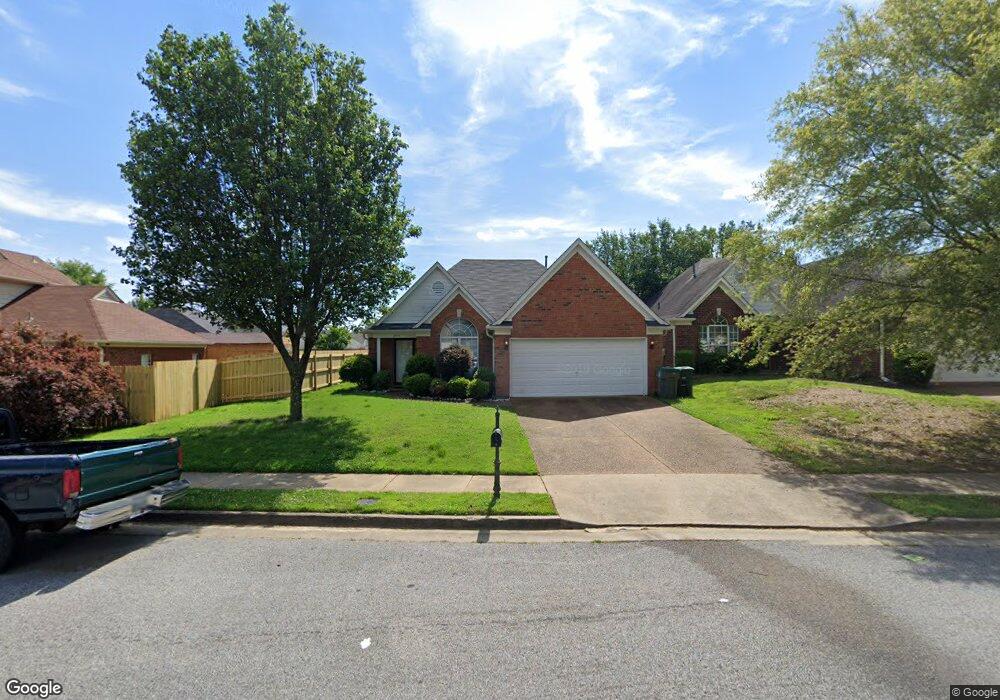
2794 Misty Bay Dr Arlington, TN 38002
Cordova NeighborhoodEstimated Value: $235,000 - $276,000
3
Beds
2
Baths
1,486
Sq Ft
$167/Sq Ft
Est. Value
About This Home
This home is located at 2794 Misty Bay Dr, Arlington, TN 38002 and is currently estimated at $247,950, approximately $166 per square foot. 2794 Misty Bay Dr is a home located in Shelby County with nearby schools including Chimneyrock Elementary School, Cordova High School, and Kate Bond Middle School.
Ownership History
Date
Name
Owned For
Owner Type
Purchase Details
Closed on
Nov 26, 2014
Sold by
Riley Nathaniel J and Jones Torrie T
Bought by
Reed Aron
Current Estimated Value
Home Financials for this Owner
Home Financials are based on the most recent Mortgage that was taken out on this home.
Original Mortgage
$117,346
Outstanding Balance
$89,986
Interest Rate
3.95%
Mortgage Type
New Conventional
Estimated Equity
$157,964
Purchase Details
Closed on
May 4, 2006
Sold by
Teixeira Kenneth H and Teixeira Anna M
Bought by
Hud
Purchase Details
Closed on
Jun 20, 2001
Sold by
Weaver Investments Llc
Bought by
Teixeira Ii Kenneth B and Teixeira Anna M
Home Financials for this Owner
Home Financials are based on the most recent Mortgage that was taken out on this home.
Original Mortgage
$131,818
Interest Rate
7.23%
Mortgage Type
FHA
Create a Home Valuation Report for This Property
The Home Valuation Report is an in-depth analysis detailing your home's value as well as a comparison with similar homes in the area
Home Values in the Area
Average Home Value in this Area
Purchase History
| Date | Buyer | Sale Price | Title Company |
|---|---|---|---|
| Reed Aron | $115,000 | None Available | |
| Hud | $138,886 | None Available | |
| Teixeira Ii Kenneth B | $132,860 | Equity Title & Escrow Co |
Source: Public Records
Mortgage History
| Date | Status | Borrower | Loan Amount |
|---|---|---|---|
| Open | Reed Aron | $117,346 | |
| Previous Owner | Teixeira Ii Kenneth B | $131,818 |
Source: Public Records
Tax History Compared to Growth
Tax History
| Year | Tax Paid | Tax Assessment Tax Assessment Total Assessment is a certain percentage of the fair market value that is determined by local assessors to be the total taxable value of land and additions on the property. | Land | Improvement |
|---|---|---|---|---|
| 2025 | $1,379 | $57,425 | $12,250 | $45,175 |
| 2024 | $1,379 | $40,675 | $7,500 | $33,175 |
| 2023 | $2,478 | $40,675 | $7,500 | $33,175 |
| 2022 | $2,478 | $40,675 | $7,500 | $33,175 |
| 2021 | $2,507 | $40,675 | $7,500 | $33,175 |
| 2020 | $2,208 | $30,475 | $7,500 | $22,975 |
| 2019 | $2,208 | $30,475 | $7,500 | $22,975 |
| 2018 | $2,208 | $30,475 | $7,500 | $22,975 |
| 2017 | $1,253 | $30,475 | $7,500 | $22,975 |
| 2016 | $1,196 | $27,375 | $0 | $0 |
| 2014 | $1,196 | $27,375 | $0 | $0 |
Source: Public Records
Map
Nearby Homes
- 9769 Misty Pine Dr
- 9761 Misty Bay Cove
- 9768 Riggin Dr
- 2756 Maggie Woods Place
- 2746 Virginia Woods Place
- 2725 Morning Sun Rd
- 9596 Morning Shadow Dr
- 9547 Morning Shadow Dr
- 9535 Daly Dr
- 2733 Breezy Ridge Trail
- 3050 Stonecrest Cir
- 9427 Morning Woods Cove
- 0000 U S Highway 64
- 10046 U S Highway 64
- 000 U S Highway 64
- 10070 U S Highway 64
- 2814 Morning Woods Dr
- 9977 Woodland Fern Dr
- 2652 Misty Woods Cove S
- 9400 Morning Woods Cove
- 2788 Misty Bay Dr
- 9751 Misty Pine Dr
- 2784 Misty Bay Dr
- 9759 Misty Pine Dr
- 2795 Misty Valley Dr
- 9765 Misty Pine Dr
- 2791 Misty Valley Dr
- 2778 Misty Bay Dr
- 2785 Misty Valley Dr
- 2791 Misty Bay Dr
- 2781 Misty Valley Dr
- 2795 Misty Bay Dr
- 2785 Misty Bay Dr
- 2774 Misty Bay Dr
- 2803 Misty Bay Dr
- 2781 Misty Bay Dr
- 2777 Misty Valley Dr
- 2807 Misty Bay Dr
- 9752 Misty Pine Dr
- 9758 Misty Pine Dr