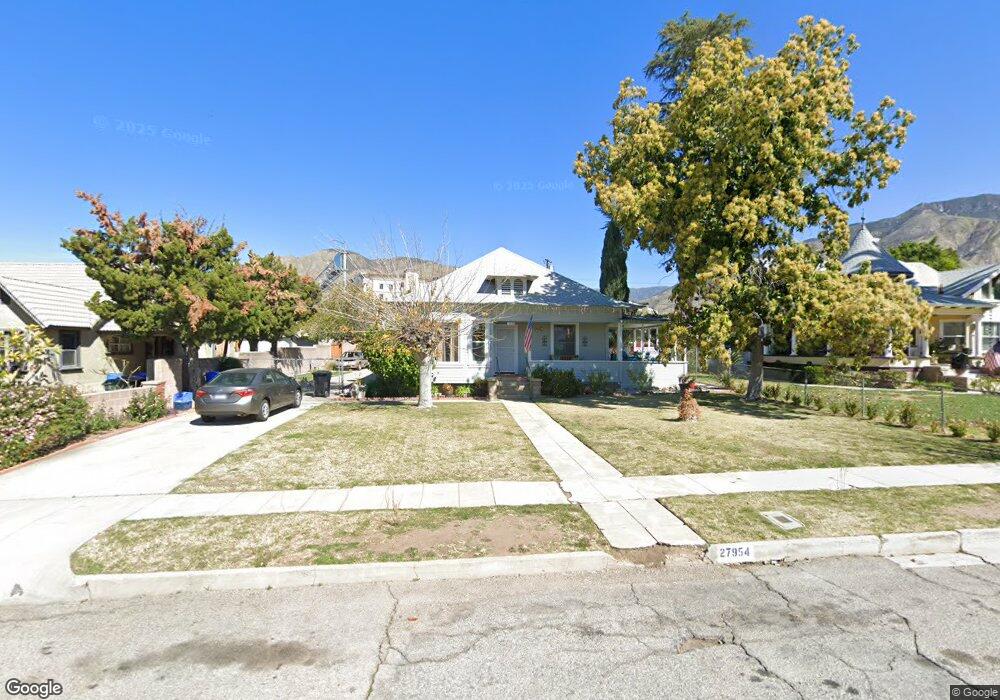
27954 Atlantic Ave Highland, CA 92346
East Highlands NeighborhoodEstimated Value: $475,553 - $530,000
3
Beds
1
Bath
1,434
Sq Ft
$355/Sq Ft
Est. Value
About This Home
This home is located at 27954 Atlantic Ave, Highland, CA 92346 and is currently estimated at $508,388, approximately $354 per square foot. 27954 Atlantic Ave is a home located in San Bernardino County with nearby schools including Bonnie Oehl Elementary School, Serrano Middle School, and San Gorgonio High School.
Ownership History
Date
Name
Owned For
Owner Type
Purchase Details
Closed on
Jan 22, 2024
Sold by
Carde Jeanne
Bought by
Carde Jeanne and Sancen Jeannette Marie
Current Estimated Value
Purchase Details
Closed on
Mar 16, 2017
Sold by
Carde Sancen Anthony A
Bought by
Carde Jeanne
Purchase Details
Closed on
Jan 28, 2013
Sold by
Mcquillen Mary
Bought by
Carde Sancen Anthony A and Lutito Eugene L
Home Financials for this Owner
Home Financials are based on the most recent Mortgage that was taken out on this home.
Original Mortgage
$137,464
Interest Rate
3.87%
Mortgage Type
FHA
Purchase Details
Closed on
Dec 11, 2012
Sold by
Lutito Sandra L
Bought by
Lutito Eugene L
Home Financials for this Owner
Home Financials are based on the most recent Mortgage that was taken out on this home.
Original Mortgage
$137,464
Interest Rate
3.87%
Mortgage Type
FHA
Purchase Details
Closed on
Jul 30, 2004
Sold by
Mignot Ernest F
Bought by
Mignot Ernest F and Mignot Nancy
Create a Home Valuation Report for This Property
The Home Valuation Report is an in-depth analysis detailing your home's value as well as a comparison with similar homes in the area
Home Values in the Area
Average Home Value in this Area
Purchase History
| Date | Buyer | Sale Price | Title Company |
|---|---|---|---|
| Carde Jeanne | -- | None Listed On Document | |
| Carde Jeanne | $103,500 | Ticor Title | |
| Carde Sancen Anthony A | $140,000 | First American Title Company | |
| Lutito Eugene L | -- | First American Title Company | |
| Mignot Ernest F | -- | -- |
Source: Public Records
Mortgage History
| Date | Status | Borrower | Loan Amount |
|---|---|---|---|
| Previous Owner | Carde Sancen Anthony A | $137,464 |
Source: Public Records
Tax History Compared to Growth
Tax History
| Year | Tax Paid | Tax Assessment Tax Assessment Total Assessment is a certain percentage of the fair market value that is determined by local assessors to be the total taxable value of land and additions on the property. | Land | Improvement |
|---|---|---|---|---|
| 2025 | $3,255 | $220,511 | $66,154 | $154,357 |
| 2024 | $3,255 | $216,187 | $64,857 | $151,330 |
| 2023 | $3,071 | $211,948 | $63,585 | $148,363 |
| 2022 | $3,072 | $207,792 | $62,338 | $145,454 |
| 2021 | $3,037 | $203,718 | $61,116 | $142,602 |
| 2020 | $3,031 | $201,629 | $60,489 | $141,140 |
| 2019 | $2,930 | $197,676 | $59,303 | $138,373 |
| 2018 | $2,832 | $151,515 | $48,701 | $102,814 |
| 2017 | $1,966 | $148,544 | $47,746 | $100,798 |
| 2016 | $1,908 | $145,632 | $46,810 | $98,822 |
| 2015 | $1,944 | $143,445 | $46,107 | $97,338 |
| 2014 | $1,891 | $140,635 | $45,204 | $95,431 |
Source: Public Records
Map
Nearby Homes
- 27953 Atlantic Ave
- 27875 Rainbow Ln
- 27888 Rainbow Ln
- 28037 Clifton St
- 0 La Praix St
- 6941 La Praix St
- 27600 Atlantic Ave Unit 427
- 28370 Coachman Ln
- 3850 Atlantic Ave Unit 58
- 3850 Atlantic Ave Unit 217
- 3850 Atlantic Ave Unit 275
- 3850 Atlantic Ave Unit 296
- 3850 Atlantic Ave Unit 257
- 3850 Atlantic Ave Unit 27
- 3850 Atlantic Ave Unit 274
- 3850 Atlantic Ave Unit 60
- 3850 Atlantic Ave Unit 151
- 3850 Atlantic Ave Unit 80
- 3850 Atlantic Ave Unit 291
- 3850 Atlantic Ave Unit 199
- 27964 Atlantic Ave
- 27942 Atlantic Ave
- 27932 Atlantic Ave
- 27982 Atlantic Ave
- 27917 Atlantic Ave
- 27994 Atlantic Ave
- 27907 Atlantic Ave
- 27563 Atlantic Ave
- 28004 Atlantic Ave
- 27991 Atlantic Ave
- 27948 Millar St
- 28018 Atlantic Ave
- 28003 Atlantic Ave
- 27966 Millar St
- 27960 Millar St
- 6742 Mountain Ave
- 27984 Millar St
- 28017 Atlantic Ave
- 27996 Millar St
- 6748 Mountain Ave